
Executive Summary:
This report presents a rigorous and conservative estimate of the number of legally eligible voters in Bihar in the year 2025, placing the figure at 7.12 crore. This estimate stands in contrast to the official electoral roll, which as of July 2025 records 7.89 crore voters, a discrepancy of 77 Lakh, or 9.7% of the roll. Such inflation raises serious concerns regarding duplication, erroneous inclusions, and non-purging of ineligible individuals.
Official voter roll (July 2025) = 7.89
Discrepancy: 77 Lakh or ~9.7%
The estimation is structured around a bottom-up demographic reconstruction model comprising three methodologically distinct but interlinked components:
- Survival-adjusted legacy voters from 2003: Based on age-cohort-specific mortality modeling.
- New voter additions born between 1985 and 2007: Estimated through CBR, fertility trends and adjusted for survival to 2025.
- Conservative deduction for permanent outmigration (2003-2025): Based on Census migration data extrapolated forward at constant rates.
All estimates are derived from official sources, including Census data, SRS Abridged Life Tables, and validated demographic literature. The modeling framework applies a deliberately conservative bias to avoid overstating the discrepancy.
Policy Implications: The substantial discrepancy of 77 Lakh voters (9.76% inflation) makes a compelling case for implementing Special Intensive Revision (SIR) of the electoral roll in Bihar. An SIR would enable comprehensive verification of voter eligibility, removal of duplicate entries, deletion of deceased and migrated voters, and systematic field verification, addressing the core issues identified in this demographic analysis. The magnitude of potential roll inflation documented here provides strong empirical justification for such an intensive administrative intervention.
1. Introduction:
In any democracy, the integrity of the voter list is both symbolic and instrumental; it reflects the scope of the polity and determines the fairness of representation. Inflated voter rolls can facilitate fraud, distort the weight of genuine votes, and allow manipulation of turnout and margins. In the context of Bihar, marked by large-scale interstate migration, weak administrative updating mechanisms, and uneven field-level enumeration, these risks are particularly pronounced.
This report seeks to provide an analytically grounded benchmark for true legal electorate in Bihar in 2025. It does so by modeling demographic flows rather than merely critiquing enumeration practices. The aim is to offer policymakers, civil society, and the Election Commission a robust baseline against which the credibility of the current roll can be assessed.
2. Estimation Framework:
We model Bihar’s 2025 eligible voter base using a demographic accounting identity:
Eligible Voters in 2025 = Survivors of the 2003 Voter List + Additions aged 18+ by 2025– Permanent Immigrants (2003-2025).
We use 2003 as the base year, as that was the year of the last Special Intensive Review conducted by the Election Commission, and therefore can be considered as the base list. Each term is estimated independently. The model avoids using electoral roll projections or interpolated growth rates. Instead, it relies exclusively on administrative and demographic data from official Indian sources.
3. Survivors from the 2003 Voter List
This section estimates the number of individuals from the 2003 voter roll of Bihar who are likely to be alive in 2025, using cohort-wise survival modeling grounded in empirical mortality data. The 2003 Voter List is chosen as this was the last time prior to the current one when a Special Intensive Revision was undertaken by the Election Commission of India. This voter list can be treated as the base voter list to project to the current number of legible voters in 2025.
The purpose is to establish a demographically sound adjustment to the historical voter base, accounting for natural attrition over a 22-year period. This forms the first crucial input into estimating Bihar’s true legal voter population in 2025, independent of roll inflation or enumeration lapses.
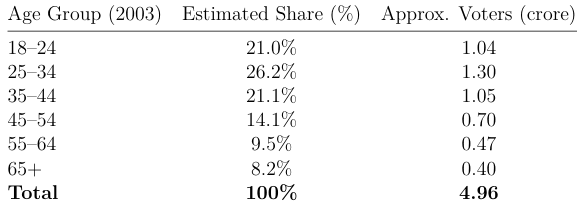
Starting Point Voter Base in 2003: The official number of registered voters in Bihar in 2003 is: 4.96 crore voters (Source: Election Commission of India, Electoral Roll Archive, 2003). To forecast how many of these individuals are alive in 2025, we must disaggregate this stock by age. Since the electoral roll is not age-coded, we rely on the adult age distribution from Census 2001, the closest reliable source.
Age Cohort Construction (2003)
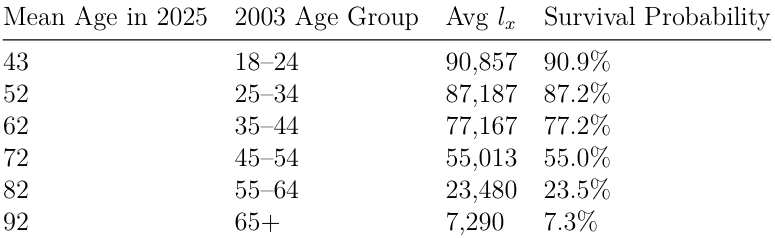
The age distribution of Bihar’s adult population was drawn from Census of India 2001 Age Tables, Bihar, Source: Office of the Registrar General & Census Commissioner, India. This was mapped proportionally onto the 2003 voter list, with each cohort aged by 22 years:
Survival Estimation:
Source and Use of lx Life Table Data: We used the SRS Abridged Life Tables published by the Registrar General of India for 2011–2015 and 2018–2022. These provide lx values, that is, survivors out of a synthetic cohort of 100,000 births to a given age. We extracted the values for the ages of interest and averaged them. Where exact ages were not tabulated, we used linear interpolation.
Survival Probability Calculation: The survival probability for a cohort aged x in 2025 is given by:
Survival Probability = lx / 100,000
This yields the likelihood that a person aged x-22 in 2003 is still alive in 2025.
Cohort-wise Survivor Computation: The number of surviving voters per cohort was computed as:
Survivors cohort=Cohort Size x Survival Probability
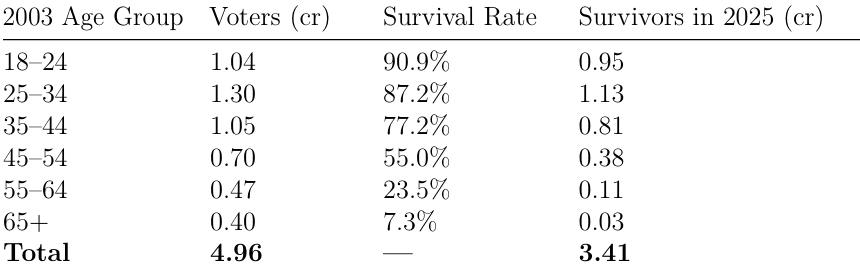
We estimate that 3.41 crore individuals from Bihar’s 2003 voter roll are still alive in 2025, assuming no migration. This forms a credible foundational block for computing the legal voter base.
This estimate is based on:
- Disaggregated voter list using Census based age structure
- State-specific mortality data from SRS
- Linear interpolation where necessary
This component is thus both demographically rigorous and policy-relevant as
a baseline adjustment to the historical voter roll.
4. New Voter Additions (Born 1985–2007):
This section estimates the number of new eligible voters in Bihar as of 2025 who were not present in the 2003 electoral roll. Specifically, we quantify individuals who:
- Were born between 1985 and 2007
- Thus turned 18 years of age between 2003 and 2025
- Are still alive in 2025
The estimation proceeds through a two-step demographic method: first estimating annual birth cohort sizes, then applying age-specific survival probabilities derived from life tables to calculate the number of survivors alive in 2025.
Step 1: Birth Cohort Estimation (1985–2007)
Framework: The number of individuals born in each year is estimated using the identity:
Births year = (CBR year/1000) ∗ Population year
Where:
- CBR is the Crude Birth Rate (births per 1,000 people), and
- Population is the estimated total population of Bihar in that year.
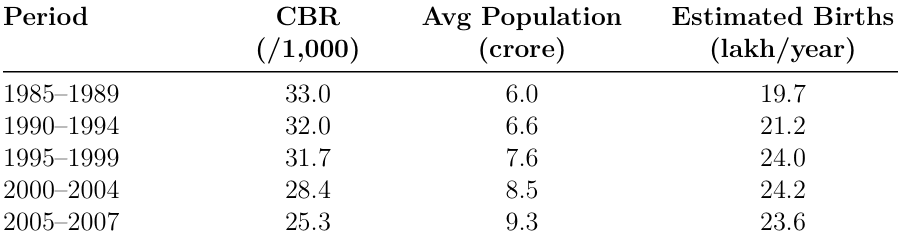
The estimated CBR values are drawn from Central Bureau of Health Intelligence (CBHI), Ministry of Health Family Welfare (MoHFW). For pre-1991 years (1985–2000), the estimates are inferred by backcasting from Census and NFHS data. The Population Estimates are based on interpolation between official Census population totals for Bihar in 1981, 1991, 2001, and 2011.
Based on this, we assign the following CBR and population values to 5-year blocks:
Step 2: Survival to 2025
Framework: Once annual birth cohort sizes are estimated, we apply survival probabilities to estimate how many individuals born in each year are likely to be alive in 2025. We use the formula:
Survivors (year) = Births (year) x Survival Probability (age)
Where:
age = 2025- birth year
Survival probabilities are derived from the lx values in the abridged life tables published by the Sample Registration System (SRS) for Bihar.
Survival Data Source: We used a hybrid average of lx values from the following sources:
- SRS Abridged Life Tables 2011–2015
- SRS Abridged Life Tables 2018–2022
This hybridization is methodologically justified because the SRS 2011–2015 data reflect survival conditions relevant for mid-life and older cohorts who were born in the 1980s and early 1990s. The SRS 2018–2022 data captures more recent improvements or distortions in survival, especially for younger age groups. Averaging these periods offers a balanced estimate, smoothing over any year-specific anomalies.
Each lx value represents the number of individuals per 100,000 who survive to a given age. We interpolated missing values linearly and normalized them to survival probabilities: Survival Probability (age) = lx/ 100,000
Survival Probability by Age in 2025:
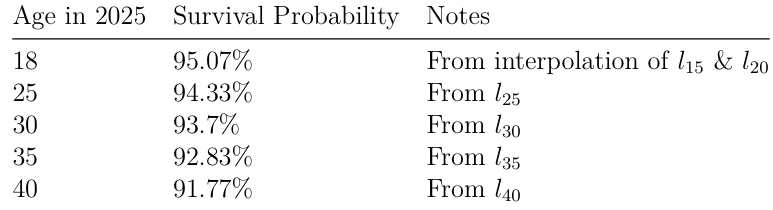
Cohort-Wise Estimation: Each birth year from 1985 to 2007 is assigned an estimated cohort size (based on CBR and population), and multiplied by the appropriate survival probability (based on age in 2025). This process is repeated year-by-year for 23 cohorts. The final output yields the number of individuals from each cohort alive and eligible to vote in 2025.
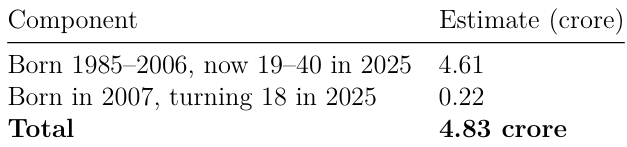
Result: Total New Voters (1985–2007 Cohorts)
This estimate assumes that all such individuals reside in Bihar in 2025, prior to adjusting for migration (addressed separately).
Sources:
- Census of India (1981, 1991, 2001, 2011)
- SRS Abridged Life Tables (2011–2015, 2018–2022), Registrar General of India
- Population Projections for India and States (2011–2036), National Commission on Population (MoHFW)
- NFHS-1, NFHS-2, International Institute for Population Sciences (IIPS)
This cohort-based methodology, grounded in official demographic data, provides a robust and transparent estimate of the number of new legal voters added to the Bihar electorate between 2003 and 2025.
5. Conservative Estimate of Permanent Net Outmigration (2003–2025)
This section presents a conservative estimate of permanent outmigration from Bihar between 2003 and 2025, assuming that there has been no increase in the annual permanent migration rate after the 2001–2011 decade. This scenario is useful as a lower-bound benchmark for adjusting Bihar’s 2025 projected voter base. Permanent outmigrants are defined as individuals who:
- Have left Bihar for residence in other states, and
- Have lived outside for 1 year or more.
Temporary migrants (e.g., seasonal labor) are excluded from this estimate
Step-by-Step Calculation
Step 1: Census 2011 Baseline (2001–2011) According to Census 2011 Table D05, the total number of migrants with duration of residence between 1-4 years and 5-9 years are 29.92 lakh and 34.04 lakh respectively. Since this is 2011 census, and we need migration figures from 2003 to 2011 with residence greater than 1 year, we extrapolate to calculate the total number of such migrants.
We also use the age bracket of 18+ for both these residency figures for our purpose, aligned with the voting age.
This yields the following result:
Migrants 2003−2011,1−4yr,>18age = 24.3 Lakh
Migrants 2003−2011,5−8yr,>18age = 25.35 Lakh
Which gives Permanent Migrants2003−2011 = 49.65 Lakh
This gives an average annual rate of migration of 5.5 Lakh per year.
Step 2: Estimating for 2012–2025 We assume that the annual permanent migration rate from 2003–2011 continues unchanged. This is a conservative estimate, as research indicates that outmigration from Bihar has been an increasing trend.
Annual Rate = 5.5 lakh/year
Permanent Migrants 2012−2025 = 5.5 x 13 = 72 lakh
Step 3: Estimating Inward Migrants: The inward migration to Bihar is very low. As a rough indicator, from the 2011 Census, the total population of Bihar is estimated at 103,804,637. On this, we have inward inter-state migrant workers per 2011 census of 7,06,557, which gives an inward migration rate of 0.68% for Bihar.
Using the same rate on the most recent non-Census estimate of Bihar population of 13 crore per the 2023 caste census gives the inward migration number of 8.8 lakh. Note that this is total inward migration, and not just the number of permanent inward migrants. For conservatism, we will use this number itself as the permanent inward migration number.
Step 4: Total Permanent Net Outmigrants (2003–2025) = 49 lakh + 72 lakh – 8.8 lakh = 1.12 crore
Interpretation:
- This estimate assumes no increase in interstate migration pressure despite growing infrastructure, education, and labor market changes.
- It offers a deliberate undercount of permanent migration to ensure conservative adjustment of Bihar’s voter base.
- The methodology aligns with practices in demographic modeling, where the goal is to bound uncertainty from above and below.
Conclusion:
Using a fixed migration rate from the 2001–2011 period, the estimated number of permanent net outmigrants from Bihar between 2003 and 2025 is: 1.12 crore. This figure ensures conservatism in voter base adjustments while maintaining demographic credibility.
6. Final Summary and Conclusions:
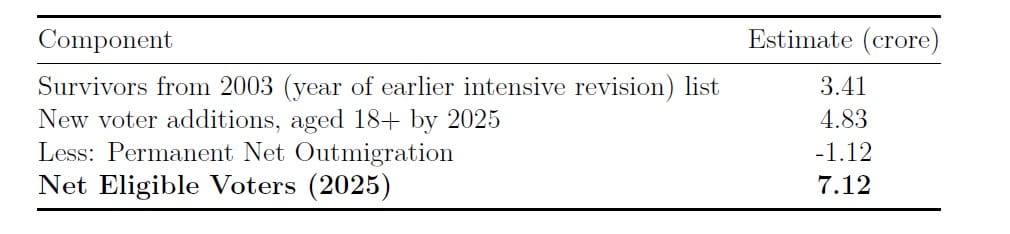
This comprehensive analysis provides a methodologically rigorous estimate of Bihar’s legitimate voter population in 2025 using demographic reconstruction principles. The three-component model yields:
- Survivors from 2003 voter roll: 3.41 crore
- New voter additions (1985–2007 births): 4.83 crore
- Less: Permanent net outmigration:- 1.12 crore
Total Estimated Legitimate Voters (2025): 7.12 crore
Compared to the official electoral roll of 7.89 crore, this suggests a potential inflation of 77 Lakh voters (9.7%). This analysis employs conservative assumptions throughout to avoid overstating discrepancies, making it a credible baseline for policy discussions regarding electoral roll integrity in Bihar.
Several causes may contribute:
- Non-removal of migrants: Voters who migrate out do not file Form 8 to deregister, leaving them on both origin and destination lists.
- Duplicate entries: The absence of a unified electoral roll allows individuals to remain registered in multiple states.
- Inclusion of undocumented residents: Urban slums and border districts are particularly vulnerable to informal or fraudulent registration.
It is worth noting that the Election Commission of India has initiated a Special Intensive Review, citing possibilities of these reasons as a source of issues that may be present in the electoral roll of Bihar.
The paper demonstrates the value of demographic accounting in electoral administration and provides a framework that could be applied to other states facing similar challenges with voter roll maintenance and migration-related adjustments.
Sources and References
• Census of India 2011, D-Series Migration Tables (D2, D3), Office of the
Registrar General
• Ministry of Labour and Employment (MoLE) (2017). Report of the
Working Group on Migration
• Census of India (1981, 1991, 2001, 2011)
• SRS Abridged Life Tables (2011–2015, 2018–2022), Registrar General of
India
• Population Projections for India and States (2011–2036), National Com
mission on Population (MoHFW)
• NFHS-1, NFHS-2, International Institute for Population Sciences (IIPS)