
Abstract
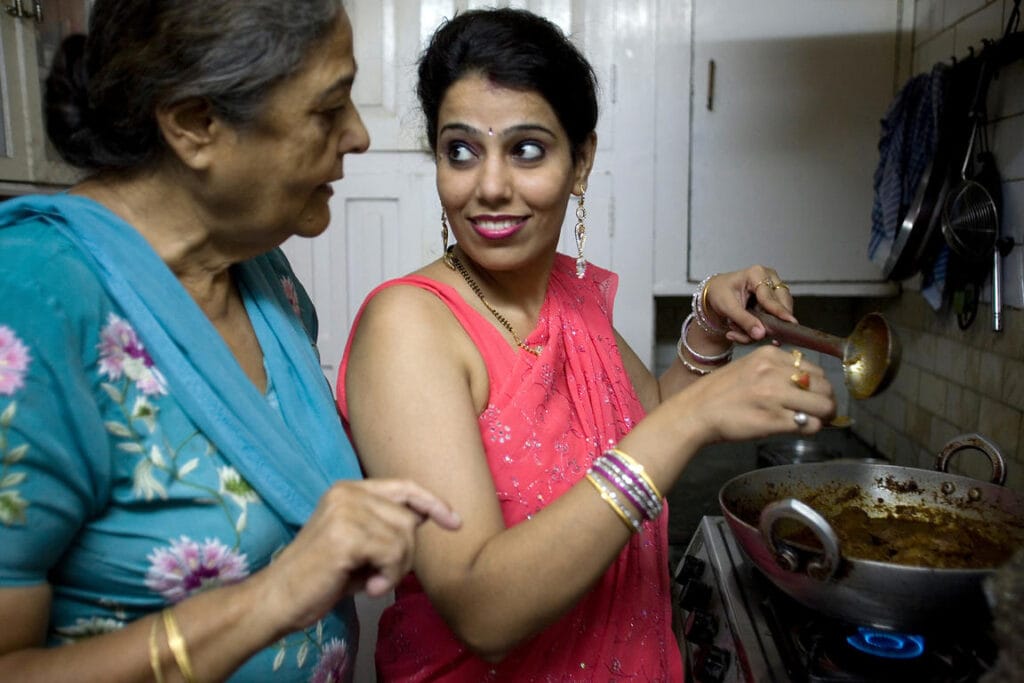
This study estimates the economic value of unpaid domestic and care work in India. Activities such as cooking, cleaning, childcare, and care for older family members are essential for households and for the wider economy, yet they remain largely invisible in standard economic measures such as Gross Domestic Product (GDP) because they do not involve market transactions. In India, women perform most of this work, creating a large and persistent gender gap in how time is spent each day.
Using the latest official Time Use Survey (TUS) 2024 and standard valuation methods from time use and national accounting research, the study focuses on a clearly defined, policy relevant population: approximately 211 million adult women (18+) whose principal activity is domestic duties, as identified through the Periodic Labour Force Survey (PLFS codes 92 and 93). These women spend 289 minutes per day on unpaid domestic services and an additional participation weighted 53 minutes per day on caregiving, totalling approximately 2,080 hours per year per woman. \
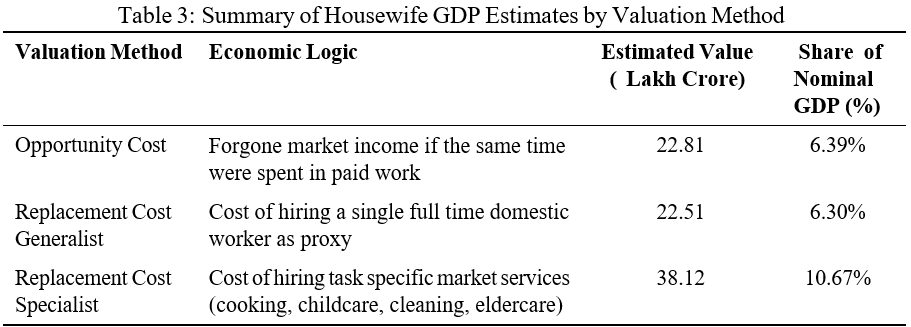
The study estimates the value of this unpaid work using two approaches: opportunity cost (forgone wages) at Rs 22.81 lakh crore (6.39% of GDP), and replacement cost estimated at Rs 22.51 lakh crore (6.30% of GDP) under a generalist domestic worker benchmark and Rs 38.12 lakh crore (10.67% of GDP) under a specialist task based benchmark.
These estimates are not presented as additions to official GDP. Instead, they are satellite account style measures that make visible a large domain of household production that standard GDP intentionally excludes. The policy message is practical: reducing women’s unpaid work burden requires better childcare and eldercare services, stronger basic infrastructure, access to time saving technology, and more equal sharing of domestic responsibilities within households. Recognition is the first step not because unpaid work should remain unpaid forever, but because what is measured can be improved, reduced, shared, and supported more intelligently through policy.
Introduction
“A long decade ago economic growth was the reigning fashion of political economy.… Disillusioned critics indict both economic science and economic policy for blind obeisance to aggregate material ‘progress’ ” (Nordhaus & Tobin, 1973, p. 509).
Half a century later, this critique remains urgent. Unpaid domestic and care work such as cooking, cleaning, childcare, and elder care constitutes the invisible infrastructure upon which markets and households depend. The Time Use Survey (TUS) 2024 confirms that women in India spend far more time than men on unpaid domestic services and caregiving, yet none of this work is reflected in standard economic indicators (NSO, 2025).
Unpaid domestic and care work done by housewives plays a central role in sustaining households and society in India. These activities include cooking, cleaning, caring for children and elderly family members, and managing daily household needs. Although this work requires time, skill, and effort, it is not counted in official economic measures such as Gross Domestic Product (GDP). As a result, a large part of women’s contribution to the economy remains invisible in policy discussions and economic statistics (Waring, 1988; Hirway, 2015). This study examines the concept of ‘Housewife GDP’ in India by estimating the economic value of unpaid domestic and care work using established measurement methods (UNECE, 2017).
1.1 Background and Rationale
India has one of the lowest female labour force participation rates among major economies (International Labour Organization [ILO], 2022; World Bank, 2022). A large share of working age women are not engaged in paid employment and are instead involved mainly in household work. Despite economic growth and rising education levels, this pattern has improved only incrementally over time. The work performed by housewives supports the paid economy by maintaining the labour force, caring for future workers, and reducing the need for market based services.
The exclusion of unpaid household work from GDP creates an incomplete picture of economic activity. When only paid work is measured, women appear less productive than men, even though they often work longer total hours when unpaid tasks are included (ILO, 2016). This has implications for how economic growth, welfare, and gender inequality are understood. Estimating the value of unpaid work is therefore necessary to better understand the true size and structure of the Indian economy and to inform gender sensitive policy design.
1.2 Definition of Unpaid Domestic and Care Work
Unpaid domestic and care work refers to activities carried out within the household that are not paid for and are not exchanged in the market (United Nations Statistics Division [UNSD], 2008). These activities produce goods and services that are consumed by household members. In this study, unpaid work includes cooking, cleaning, washing clothes, fetching water or fuel, shopping for household needs, caring for children, caring for elderly or sick family members, and supervising or helping children with education (ILO, 2018).
It is important to distinguish unpaid domestic and care work from unpaid family labour in market activities, such as working on a family farm or business. While unpaid family labour contributes to market production and is already counted indirectly in GDP, unpaid domestic services provided within one’s own household are excluded by definition from core national accounts (UNSD, 2008). This study focuses only on unpaid domestic and care work that lies outside the production boundary of GDP.
1.3 Why Unpaid Work is Excluded from GDP
GDP measures the value of goods and services produced and exchanged in the market. National accounting systems count activities where there is a clear monetary transaction or where output can be reasonably valued using market prices (UNSD, 2008). Unpaid household work is excluded because it does not involve market exchange and because valuing it raises methodological challenges, such as choosing appropriate wage rates and avoiding double counting.
International accounting standards, such as the System of National Accounts (SNA), recognize household production but place most unpaid domestic services outside the core GDP framework (UNSD, 2008). Instead, they recommend measuring such activities through satellite accounts that exist alongside GDP without changing its official definition. While this approach maintains consistency in GDP measurement, it comes at a significant cost.
The work that remains outside GDP is not small or marginal. In India, women spend nearly eight times more hours per day on unpaid domestic and care work compared to men (NSO, 2020). When this work is assigned a monetary value, estimates vary widely depending on the method used. The SBI Research (2023), using a minimum wage approach with assumed monthly earnings of Rs 5,000 for rural women and Rs 8,000 for urban women, estimated that unpaid work by women amounts to approximately 7.5 percent of India’s GDP. In contrast, using replacement cost and opportunity cost methods, Sahoo, Sarkar, and Kumar (2024) estimated this figure to be between 24.6 and 32.4 percent of GDP. Regardless of the method, the scale of this invisible contribution is substantial, yet it does not appear in any headline economic indicator. This exclusion is not a technical accident. It is the central problem that this study seeks to address.
1.4 Research Objectives and Scope
The objective of this study is to estimate the economic value of unpaid domestic and care work associated with housewives in India, assess its size relative to India’s nominal GDP, and show why this invisible work matters for economic measurement and public policy. The study applies two valuation approaches: (i) opportunity cost and (ii) replacement cost (generalist and specialist) (UNECE, 2017).
The scope is restricted to unpaid household services produced within the household (such as cooking, cleaning, and care work). The primary estimates relate to the “housewife” population as operationally defined in the Methodology using Periodic Labour Force Survey status categories (NSO, 2023).
The results are presented in a satellite account style consistent with the System of National Accounts 2008 framework (UNSD, 2008). They are meant to improve the measurement and visibility of household production and to support better policy discussion on care work and women’s economic contribution, not to revise official GDP.
2. Literature Review
2.1 Theoretical Foundations of Household Production
For a long time, economics treated production as an activity that happens mainly in factories, offices, and markets. Work done inside the home was seen as “non economic” because it did not involve buying or selling (Waring, 1988). As a result, household work was kept outside most economic models.
This view began to change in the mid 20th century. A major contribution came from Gary Becker. In his work A Theory of the Allocation of Time (1965), Becker argued that households are also productive units. According to this idea, people divide their time between paid work, leisure, and household production. Time spent on housework has an opportunity cost, because it could have been used for paid work or other activities (Becker, 1965).
This approach, often called the “New Home Economics,” explains how household members use time and inputs to produce services such as meals, clean clothes, and childcare. These services have value even if no money is exchanged (Ironmonger, 1996). Later research built on this framework and showed that decisions about paid work and unpaid work are closely linked (Folbre, 2006). This theory provides the base for valuing unpaid domestic work using methods like opportunity cost and replacement cost (UNECE, 2017).
2.2 Feminist Critiques of National Accounting Systems
Feminist economists have strongly criticized the way national income measures ignore unpaid household work. They argue that what is not measured is often not valued in policy (Elson, 2017; Folbre, 2006).
A well known critique comes from Marilyn Waring in her book If Women Counted (1988). She showed that GDP counts many non market activities, such as government services, but excludes unpaid domestic work done mostly by women. This creates a gender bias in economic measurement (Waring, 1988).
International accounting rules, especially the System of National Accounts (SNA), responded partly to these critiques. Since the 1990s, the SNA has allowed countries to create “satellite accounts” to measure unpaid household production without changing official GDP (UNSD, 2008). However, in practice, most unpaid domestic services like cooking and caring for one’s own family still remain outside core GDP (Hirway, 2015; UNECE, 2017). This gap between what theory allows and what is actually done remains a key issue in the literature (Budlender, 2010).
2.3 Global Evidence on Valuing Unpaid Work
Studies from many countries show that unpaid domestic and care work is economically large when valued in monetary terms (UNECE, 2017; van de Ven et al., 2018). However, the estimated GDP share varies widely because countries use different valuation methods (opportunity cost vs replacement cost), different wage benchmarks (minimum wages vs market wages), and different activity coverage (narrow vs comprehensive task lists) (UNECE, 2017).
Research also shows that women do most unpaid work across the world, and this imbalance is often larger in regions such as South Asia and parts of Africa and the Middle East. Because unpaid work takes time, it can limit women’s ability to participate in paid employment, education, or skill training (ILO, 2018; Alonso et al., 2019).
For this reason, global policy discussions often refer to the “three Rs”: recognition of unpaid work, reduction of unpaid work through services and technology, and redistribution of work between men, women, and the state (Elson, 2017).
2.4 Indian Context and Previous Empirical Estimates
India is an important case because women’s participation in paid work is low, while unpaid domestic work is very common. Many working age women are mainly engaged in household duties rather than paid employment (NSO, 2023; World Bank, 2022).
Early efforts to study unpaid work in India include a pilot Time Use Survey in 1998 99, conducted across six states by the Central Statistical Organisation (CSO, 2000). However, for many years after that, India lacked national level time use data. Researchers had to rely on small studies or indirect estimates (Hirway & Jose, 2011; Hirway, 2015; Mehta & Pratap, 2017; Nikore, 2022).
This changed with the national Time Use Survey conducted by the National Statistical Office in 2019, and reinforced by the updated Time Use Survey in 2024 (NSO, 2020; NSO, 2025). The surveys show that a very large share of Indian women spend several hours each day on unpaid domestic and care work, while men spend much less time. These patterns are among the most unequal in the world (ILO, 2018) and are central to understanding women’s low participation in paid work.
Recent valuation studies in India show very different results depending on method and wage assumptions. State Bank of India (2023) estimates the value of unpaid work done by women at 22.7 lakh crore (rural 14.7 lakh crore and urban 8.0 lakh crore), which is about 7.5% of India’s GDP, using a conservative wage benchmark approach. In contrast, academic studies using broader task coverage and alternative valuation choices report higher totals. For 2019 20, Sahoo, Sarkar, and Kumar (2024) report 49.5 lakh crore (24.6% of GDP) under a gross opportunity cost valuation and 65.1 lakh crore (32.4% of GDP) under replacement cost valuation. These differences do not reflect disagreement about whether unpaid work is large; they mainly reflect differences in method, wage benchmarks, and how comprehensively unpaid work is counted. Importantly, many high GDP share estimates refer to unpaid work valued across a broader population and task coverage; later sections therefore define the target population clearly to ensure like for like comparisons.
2.5 Identified Gaps in Existing Literature
Despite extensive research, several gaps remain.
First, many studies do not clearly explain their assumptions, such as which activities are included and which wages are used. This makes comparison difficult (UNECE, 2017; Hirway, 2015). Presenting a range of estimates is often more useful than a single number.
Second, although international guidelines allow satellite accounts (UNSD, 2008), India does not yet produce regular household production satellite accounts (Sahoo, Sarkar, & Kumar, 2024; Hirway, 2015). This limits the use of unpaid work estimates in official policy.
Third, many studies do not fully examine differences within India, such as rural versus urban areas, education levels, or stages of life (Nikore, 2022; Hirway & Jose, 2011). These differences matter for understanding who bears the largest unpaid work burden.
Finally, there is limited work linking unpaid work valuation directly to policy design, such as childcare services, eldercare systems, or strategies to reduce time poverty (Elson, 2017; ILO, 2018). Addressing these gaps is important for making unpaid work visible in both economic analysis and public decision making.
3. Methodology
3.1 Conceptual Framework
This study is based on the idea of household production. Household production means goods and services produced inside the home for family use—such as cooked meals, clean clothes, and care for children or elderly family members. These services are essential for daily life and they support the paid economy, even though they are not bought and sold in markets (Hirway, 2015; UNECE, 2017).
Because unpaid household work does not involve market transactions, it is excluded from official GDP (UNSD, 2008). This exclusion does not mean the work has no value. If household work was not done within the family, households would need to purchase similar services from the market (for example, cooking help, cleaning help, or caregiving) or rely more on public services. This is the economic logic behind valuation (UNECE, 2017).
The study reports results in a satellite-account style format. That means we estimate the value of unpaid domestic and care work and present it alongside GDP, without changing official GDP itself (UNSD, 2008). The purpose is better measurement and visibility, not redefining national income.
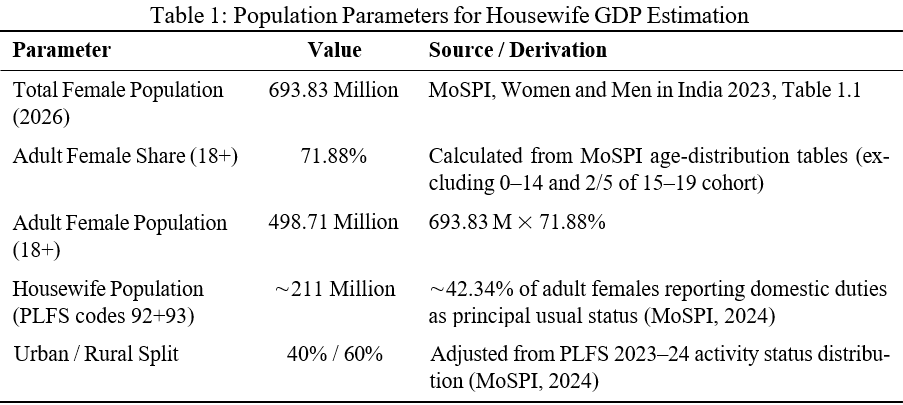
To keep the estimates policy-relevant and to avoid confusion in interpretation, the main “House- wife GDP” estimates focus on adult women (18+) whose principal activity in the PLFS is domestic duties (codes 92 and 93).1 This definition targets women for whom unpaid household work is the main work status, rather than mixing unpaid work done by people who are primarily in paid employment (NSO, 2023).
Using official MoSPI population projections and the PLFS 2023–24 activity status distribution, we estimate that approximately 211 million adult women (18+) report domestic duties as their usual principal status. Table 1 presents the step-by-step derivation of this population base.
3.2 Time Use Survey as a Basis for Measurement
Time is the core input in unpaid domestic and care work. So the first step in this study is to measure how much time women spend on these activities, using India’s official Time Use Survey (TUS) 2024 conducted by the National Statistical Office. The TUS records how people spend a full day across different activities and reports national averages by gender and other basic characteristics.
From TUS 2024, we take two time components that directly correspond to unpaid household production:
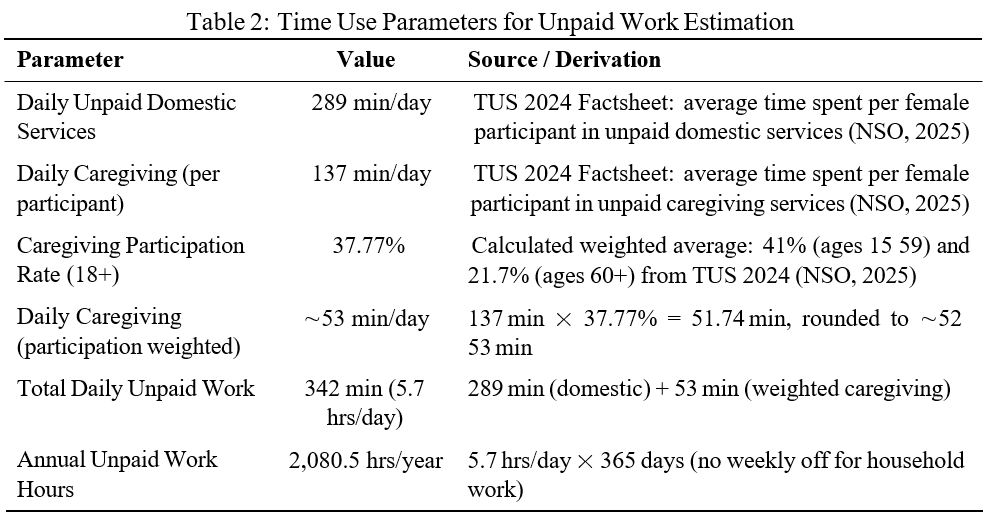
- Unpaid domestic services (such as cooking, cleaning, washing, and other routine household chores). TUS 2024 reports that women spend 289 minutes per day on unpaid domestic services.
- Unpaid caregiving (such as caring for children, the elderly, or sick family members). Care work is not done by everyone every day, so we treat this more carefully. We use TUS reported caregiving participation rates 41% for females aged 15 59 and 21.7% for females aged 60+ to construct an adult (18+) caregiving participation baseline of 37.77%. We then convert caregiving time into an “average per woman” by applying this participation weight to the caregiving time per participant (137 minutes/day for female caregivers). This gives about 53 minutes/day of caregiving time per adult woman on average.
Adding the two components gives a realistic daily unpaid work volume of about 5.70 hours per day per adult woman, which is then converted into annual hours using a 365 day year (because unpaid household work does not follow weekly offs like formal jobs). This produces 2,080.5 hours per year as the time basis used in the valuation methods that follow.
This time use step is intentionally separated from wage assumptions. First we measure the quantity of unpaid work (hours), and only after that do we apply wage benchmarks for the opportunity cost and replacement cost valuations.
3.3 Valuation Approaches
This study uses two standard approaches to value unpaid domestic and care work. These two approaches are time based methods (they value hours × wage). We present a range because each method answers a slightly different economic question.
In all primary (time based) estimates, we apply the valuation to a policy relevant group identified in PLFS: adult women (18+) whose usual principal status is domestic duties (codes 92 and 93). This helps keep the main results focused on women for whom domestic work is the primary activity, instead of mixing in people who are mainly in paid work.
3.3.1 Opportunity Cost Method
The opportunity cost method values unpaid work by asking a simple question: what income could a woman have earned if the same time was spent in paid work instead of household work? Since time is limited, spending more time on unpaid household work reduces the time available for paid employment (UNECE, 2017).
In this study, we implement the opportunity cost method using transparent benchmark wages rather than predicted wages for each education or age group. We use conservative, round number benchmark monthly wages of 15,000 in urban areas and 8,000 in rural areas, calibrated to lie between typical self employed and salaried female earnings reported in PLFS 2023 24 earnings tabulations (MoSPI, 2024). For reference, PLFS data for April June 2024 show higher average earnings for salaried women (around 12,400 in rural areas and 19,900 in urban areas) and lower earnings for self employed women (around 5,200 in rural areas and about 8,500 in urban areas) (MoSPI, 2024), consistent with our benchmarks being conservative mid range values rather than exact PLFS point estimates. We convert these benchmark monthly wages to hourly wages using a 26 working day month and an 8 hour workday, a standard convention for market work in applied labour economics valuations (UNECE, 2017). These hourly wages are then applied to the annual unpaid work hours derived from TUS 2024 (NSO, 2025) and aggregated across the PLFS 92+93 population (MoSPI, 2024).
This approach gives a conservative, easy to audit estimate because every input is visible: hours come from TUS (NSO, 2025), the population comes from PLFS status codes (MoSPI, 2024), and the wage benchmarks are explicitly stated and calibrated to observed female earnings distributions rather than being estimated from a wage equation.
3.3.2 Replacement Cost Method (Specialist & Generalist)
The replacement cost method values unpaid work by asking a different question: if households had to buy these services from the market, what would they have to pay? This approach is often higher than opportunity cost because replacing household work may require hiring multiple services (UNECE, 2017).
We estimate two versions:
Generalist replacement cost. This assumes a single domestic worker can cover multiple household tasks (cleaning, basic cooking support, and routine help). It produces a lower bound replacement estimate. In this study, we use representative monthly domestic worker wages of 16,500 in urban areas and 9,500 in rural areas, chosen by the authors and calibrated to fall within the prevailing range of full time domestic worker salaries reported by organised placement agencies and state level minimum wage schedules for domestic workers in 2023 25 (Book- MyBai, 2025; JobNukkad, 2025; WageIndicator Foundation, 2025; Paycheck.in, 2025). Since domestic help is typically paid as a monthly arrangement, we convert monthly wages to hourly wages using a 30 day month and an 8 hour day.
Specialist replacement cost. This recognises that household work includes different tasks that have different market prices (for example, cooking, childcare, and care support are priced differently). Instead of one uniform wage, we use weighted specialist hourly rates as market proxies: 118/hour in urban areas and 66/hour in rural areas, based on observed agency quoted market rates for cooking, cleaning, childcare and elderly care services, combined with the task time shares for unpaid domestic and care work in the Time Use Survey 2024 (NSO, 2025; Book- MyBai, 2025; JobNukkad, 2025). This specialist method represents a more comprehensive “full replacement” ceiling among the time based methods (UNECE, 2017).
Both replacement methods apply the same annual hours base from the Time Use Survey 2024 (NSO, 2025) and the same PLFS 92+93 population base (MoSPI, 2024); the only difference is the wage benchmark used.
3.4 Data Sources (TUS, PLFS, Wage Data, Price Benchmarks)
This study uses official Indian statistics for population, time use, and labour status, and then applies transparent wage and price proxies to convert unpaid work into monetary values. Each source has a specific role, and we keep the assumptions visible so the estimates can be audited and replicated.
The time inputs come from the National Statistical Office Time Use Survey (TUS) 2024, which reports how much time women spend on unpaid domestic services (minutes per day) and participation rates for caregiving across age groups (NSO, 2025). These figures are used to construct daily and annual unpaid work hours.
The macro baseline comes from Ministry of Statistics and Programme Implementation publications: the female population and age structure are taken from official population tables (MoSPI, 2023), and nominal GDP is taken from the First Advance Estimates for FY 2025 26 (MoSPI, 2026). This keeps the GDP denominator and population totals consistent with official national accounts.
The “Housewife GDP” population is defined using Periodic Labour Force Survey usual principal status categories. Specifically, we use principal status codes 92 and 93 to identify adult women whose main activity is domestic duties, with or without free collection for household use (MoSPI, 2024). PLFS is also used to anchor the broad urban rural split applied in the valuation.
Wage and price benchmarks are taken from publicly observable market proxies for household services and low end labour market pay. For opportunity cost, we apply simple benchmark monthly wages (urban 15,000; rural 8,000) calibrated to PLFS 2023 24 female earnings tabulations (MoSPI, 2024) and converted to hourly values using a standard 26 day working month. For replacement cost, we use domestic worker monthly wage proxies (generalist) and weighted hourly market proxies (specialist). These benchmarks are calibrated to organised placement agency rates and state level minimum wage schedules for domestic workers (BookMyBai, 2025; JobNukkad, 2025; WageIndicator Foundation, 2025; Paycheck.in, 2025).
All market benchmarks are used as proxies, not as precise national averages. That is why results are reported as ranges where appropriate, and the study is explicit about which benchmark is used in each method.
3.5 Estimation Strategy and Model Specifications
The estimation process follows a clear and sequential approach.
First, we convert time use data into annual unpaid work hours. We start with the Time Use Survey (TUS) 2024 for unpaid domestic work time. For unpaid caregiving, we do not assume that every woman provides care every day. Instead, we use the official caregiving participation rates to convert caregiving time into a realistic “average per person per day” figure. We then add domestic work time and participation weighted caregiving time to obtain total unpaid work time per day, and convert this into annual hours.
Second, we define the population group for valuation using the Periodic Labour Force Survey (PLFS). The main estimates are calculated for adult women (18+) whose usual principal status is domestic duties (PLFS codes 92 and 93). This gives the base number of homemakers used for aggregation, along with the rural urban composition used for applying different wage benchmarks.
Third, we apply the valuation methods separately:
- Opportunity cost method: we value annual unpaid work hours using a market wage benchmark that represents what a comparable worker could earn in paid work.
- Replacement cost method (generalist): we value the same unpaid hours using the wage of a general domestic worker who performs multiple household tasks.
- Replacement cost method (specialist): we value the same unpaid hours using task based market service rates, reflecting that different household tasks have different replacement prices.
Fourth, we present results as a range rather than a single point estimate, because each method captures a different economic meaning (forgone earnings versus market replacement costs).
Finally, we express the estimates as shares of nominal GDP for the relevant year to show economic scale. These are satellite account style figures: they are meant to improve measurement and visibility of household production, not to revise official GDP.
4. Data Collection and Analysis
4.1 Time Use Patterns Among Women in India
The Time Use Survey (TUS) 2024 is India’s official survey on how people spend a full 24 hour day across paid work, unpaid household work, care work, learning, leisure, and self care. It was carried out from January to December 2024 for persons aged 6 years and above, covering 83,247 rural households and 56,240 urban households, with 454,192 individuals in total.
The survey shows a very large gender gap in unpaid domestic services (cooking, cleaning, washing, and similar household chores). On average, women spend 289 minutes per day on unpaid domestic services, while men spend 88 minutes per day. The gap is also visible in participation: 81.5% of women reported doing unpaid domestic services on the reference day, compared to 27.1% of men.
A similar pattern appears for unpaid caregiving (care for children, elderly members, or sick relatives). Women spend 137 minutes per day on unpaid caregiving, compared to 75 minutes per day for men. Daily participation in caregiving is 34.0% for women and 17.9% for men.
The same fact sheet also shows that women’s participation in employment and related activities is much lower than men’s: 20.7% for women versus 60.8% for men on the reference day.
Taken together, the TUS 2024 evidence is clear: women carry most routine household work and care work in India, and this unequal time burden is a central reason why unpaid work matters for understanding labour outcomes and economic well being.
4.2 Opportunity Cost Estimates
The opportunity cost method values unpaid domestic and care work by asking a simple question: how much income is given up when time is spent on household work instead of paid work? In this report, the “Housewife GDP” concept is defined using PLFS usual principal status codes for domestic duties. Code 92 refers to women who attended domestic duties only, while Code 93 refers to women who attended domestic duties and also did household use activities (such as free collection of goods like firewood/fodder, or sewing/tailoring/weaving for the household). Using the 2026 population base in this report, the estimated cohort is 211.15 million adult women (18+) in codes 92+93. For valuation, we use a simple and defensible split of this group into 40% urban (84.46 million) and 60% rural (126.69 million), since domestic duties are more common in rural India but still substantial in cities.
The time basis for valuation is taken from India’s official Time Use Survey (TUS) 2024. The fact sheet reports that women spend 289 minutes per day on unpaid domestic services. Caregiving is treated more carefully: we do not assume that everyone provides care every day. Instead, we use caregiving participation rates reported in the official TUS releases 41% for females aged 15 59 and 21.7% for females aged 60+ to create an adult (18+) caregiving participation baseline of 37.77%. Using the caregiving time benchmark of 137 minutes per day (for caregiving participants), this gives an average caregiving time of about 53 minutes per day at the adult population level. Adding this to domestic work time gives a realistic total daily unpaid work volume of about 342 minutes per day (≈ 5.7 hours/day), which annualises to roughly 2,080.5 hours per woman per year.
To convert time into money, we use clear “benchmark wages” rather than complicated wage prediction models. The assumed opportunity wage is 15,000 per month in urban areas and 8,000 per month in rural areas, converted using a standard labour market convention of 26 working days per month and an 8 hour workday. When these wages are applied to the annual unpaid work hours and then added across the full 211.15 million cohort, the total opportunity cost value of unpaid domestic and care work performed by housewives in 2026 is approximately 22.81 lakh crore.
Finally, we compare this value with India’s overall economy. MoSPI’s First Advance Estimates put nominal GDP in FY 2025 26 at 357.14 lakh crore. On that basis, the opportunity cost “Housewife GDP” is about 6.39% of GDP. In simple words: even after using a careful method that avoids over counting caregiving, the unpaid work done at home is still very large in economic terms. Daily tasks like cooking, cleaning, and caring for children or elders keep households running, and that support is what makes regular paid work and the wider economy possible.
4.3 Replacement Cost Estimates
The replacement cost method values unpaid domestic and care work by estimating how much households would need to pay if these services were replaced by paid workers from the market. Instead of asking what women could earn in paid employment, this approach asks what it would cost to hire workers to perform the same household tasks. This study presents two versions of the replacement cost method: a specialist (task wise) replacement approach and a generalist domestic worker approach, in order to show a realistic range of estimates. Both versions use the same core workload and population base: 211.15 million women (18+) in PLFS codes 92+93, the same 2,080.5 hours/year, and the same 40% urban / 60% rural population split.
Under the generalist replacement approach, we assume households hire one full time domestic worker who covers multiple tasks (cleaning, basic cooking help, and routine household support). The wage benchmarks are drawn from observable market listings, organised placement agency rates, and state level minimum wage schedules for domestic workers (BookMyBai, 2025; JobNukkad, 2025; WageIndicator Foundation, 2025; Paycheck.in, 2025). Full time domestic worker salaries typically range from 10,000 18,000 per month in urban areas and 6,000 10,000 per month in rural and smaller markets. Based on this evidence, we set a clear benchmark of 16,500/month for urban areas and a conservative 9,500/month for rural areas both chosen by the authors as moderate mid range values within the observed salary band. Converting monthly pay to hourly cost using a 30 day month and 8 hours/day gives 68.75/hour (urban) and 39.58/hour (rural). Applying these rates to the annual hours and aggregating yields a gen- eralist replacement value of 22.51 lakh crore, which is about 6.30% of GDP (using MoSPI nominal GDP 357.14 lakh crore).
Under the specialist replacement approach, we recognise that household work is not one single job. Cooking, childcare, and elder/patient care often price very differently in real markets, and fully outsourcing them typically means hiring specialised workers or paying for specialised services. To capture that, we use higher effective hourly specialist rates. The market anchors used to construct these are drawn from the same organised placement agency sources and occupation level earnings data from PLFS tabulations (MoSPI, 2024; BookMyBai, 2025; JobNukkad, 2025). Across these sources, monthly salaries for specialised cooks typically range from 12,000 20,000, for childcare workers from 8,000 16,000, and for eldercare attendants from 10,000 22,000, with considerable variation by city and skill level. Using these market signals, we con- struct composite specialist rates of 118/hour (urban) and 66/hour (rural), weighted by the task time shares from TUS 2024 (NSO, 2025). These rates serve as a practical proxy for outsourcing multiple tasks and services rather than hiring one generalist. Applying these rates to the annual hours and aggregating gives a specialist replacement value of 38.12 lakh crore, equal to about 10.67% of GDP.
Taken together, the replacement cost framework shows a clear range: about 6.30% of GDP under a conservative “one worker” generalist model, and up to about 10.67% of GDP under a more complete specialist outsourcing model. Even the lower estimate is very large, because it represents real work that households rely on every day but which does not appear in standard GDP.
These estimates are carried forward into Section 5 for comparative discussion, interpretation, and validation against independent Indian and global benchmarks.
4.4 Validation and Robustness Checks
Comparison with independent and global studies. A useful way to judge whether our numbers are “in the right ballpark” is to compare them with how unpaid care and domestic work is valued in other countries and in cross country studies. APEC’s cross economy study reports that estimated values can vary widely from about 5.5% of GDP to over 41% of GDP mainly because countries use different valuation methods and wage benchmarks. UNDESA’s 2025 discussion note makes the same point: in some countries, unpaid work can exceed 40% of GDP when valued comprehensively.
In that global context, our 2026 “Housewife GDP” range 6.30% to 10.67% of GDP (generalist replacement to specialist replacement), with an opportunity cost estimate of 6.39% is clearly within internationally observed ranges, and it is also internally consistent with the fact that Indian women spend large amounts of time on unpaid work.
Our estimates are not meant to cover every woman or all unpaid work in India. We define the “Housewife GDP” population using PLFS usual principal status codes 92 and 93 adult women (18+) whose primary activity is domestic duties. Because this definition is focused on women for whom domestic work is the main status, the GDP shares we report will be lower than studies that value unpaid work across all women or across the entire adult population.
Sensitivity to wage assumptions. We checked how the totals change if we use lower or higher wage benchmarks. The logic is simple: time based valuation is basically hours × wage. So if the wage benchmark goes down, the total goes down, and if the wage benchmark goes up, the total goes up. That is why we report a range rather than one “perfect” number. In our opportunity cost estimate we use 15,000/month (urban) and 8,000/month (rural), converted using a 26 day work month (standard for market jobs). In the generalist replacement estimate, we use domestic worker market wages and convert them using a 30 day month, because domestic help is usually paid monthly. These choices keep the valuation realistic and easy to audit. Even with these conservative wage benchmarks, the totals remain in the tens of lakh crore, which shows the economic scale is large and not driven by any one aggressive assumption.
Multitasking and time constraints. Unpaid household work often involves doing more than one thing at the same time for example, cooking while supervising a child. To avoid overstating the total, this report follows a simple rule used in time use accounting: one hour of a person’s time is counted only once, even if multiple tasks happen within that hour. The caregiving com- ponent is also treated carefully using participation weighting, so we do not assume everyone provides care every day.
Internal consistency and behavioural patterns. The assumptions used in this report are consistent with basic, well known household behaviour. Families with young children naturally need more daily care, so unpaid caregiving time is higher in those households, and this burden falls mainly on women. This is reflected in the Time Use Survey pattern itself: caregiving is not universal every day, which is why we apply participation weighting rather than assuming everyone provides care daily. In addition, households with higher incomes are more likely to use paid help for some tasks (such as cleaning or childcare) or rely on appliances, which can reduce the amount of unpaid time required at home. When a task is outsourced to a paid worker, that service is already counted in the economy through market transactions. Our valuation is designed to avoid overlap by (i) focusing the “Housewife GDP” population on women whose principal status is domestic duties (PLFS codes 92+93) and (ii) using conservative rules for time allocation and wage imputation, so the estimates reflect unpaid work performed within the household rather than services already purchased in the market.
Across reasonable choices of time anchors, participation rates, and wage proxies, the headline conclusion does not change: unpaid domestic and care work done by women especially those whose primary status is domestic duties forms a large, economically meaningful sector that standard GDP accounting does not record. Benchmarked against India’s 357.14 lakh crore nominal GDP (FY 2025 26 First Advance Estimates), our main 2026 valuations fall in a stable band: about 6% 11% of GDP.
5. Discussion
5.1 Comparative Results Across Valuation Methods
This study uses two approaches to estimate the economic value of unpaid domestic and care work in India: an opportunity cost method and two replacement cost variants (generalist and specialist). These approaches measure different things, so the results should be read as a range rather than a single “true” number. A key point for interpretation is that our 2026 estimates are defined for a specific population: adult women (18+) whose principal status in PLFS is domestic duties (codes 92+93). This “Housewife GDP” definition is narrower than studies that value unpaid work across all women or all adults, so the GDP shares here are naturally smaller than “whole economy unpaid work” estimates.
Using this population base (about 211.15 million women in 2026), the opportunity cost method values unpaid work using benchmark market wages for urban and rural women. Under the audit ready assumptions applied in this report, the estimated opportunity cost value is 22.81 lakh crore, which is 6.39% of India’s nominal GDP (FY 2025 26). This opportunity cost estimate can be read as a conservative floor within the time based methods because it is tied to what the same person could plausibly earn in the labour market.
Replacement cost estimates answer a different question: what would households need to pay if the same work had to be purchased from the market. We present two replacement variants to show a realistic band. The generalist replacement method assumes one all purpose domestic worker wage and gives a total of 22.51 lakh crore (6.30% of GDP). The specialist replacement method uses higher, task specific service wages (for example, cooks and caregivers) and produces a larger estimate of 38.12 lakh crore, or 10.67% of GDP. The specialist estimate is higher because replacing household production fully typically requires higher cost care services and, conceptually, more specialised labour than a single uniform wage captures.
Overall, the methods point to the same conclusion even though they differ in concept: unpaid domestic and care work performed by the “housewife” population is economically large. The time based estimates imply a “Housewife GDP” of roughly 6% to 11% of nominal GDP in 2026. These figures are not meant to be added mechanically to official GDP; they are best understood as satellite account style estimates that make visible a major productive sector that standard GDP accounting leaves out.
5.2 Interpretation of Estimates (GDP Share & Economic Rank)
The valuations in our report place a GDP scale number on unpaid domestic and care work performed within households. These estimates should be read as satellite account magnitudes: they are not proposed as additions to official GDP, but as a way to make visible a large category of production that standard accounts do not price.
A key scope point improves comparability. The primary estimates here are not for all unpaid work done by all women. They are for a policy relevant population definition: adult women (18+) whose PLFS principal status is domestic duties (codes 92 and 93). Because the group is defined around “domestic duties as the main activity,” the GDP shares reported here will naturally be lower than studies that value unpaid work across the entire adult population.
As summarised in Table 3, the time based methods yield a range of 6.30% to 10.67% of nominal GDP. Replacement cost is higher especially the specialist version because replacing household production in the market usually requires multiple paid services (cook, cleaner, childcare, elder care), not one uniform worker. Opportunity cost can be lower because it is tied to labour market wages and job access; in many settings, the market wage a woman could earn may be less than the cost a household would actually pay to replace her work at home.
In economic terms, even the conservative end of the range is large. A 6 11% share of nominal GDP implies a sector sized volume of activity that supports daily household functioning and enables paid work outside the home.
Overall, the interpretation is stable across methods: within the defined “housewife” population, unpaid domestic and care work is not a small side activity. It is a macroeconomically significant production base that remains largely invisible in standard GDP, and a necessary input into how the rest of the economy operates.
5.3 Gendered Distribution of Unpaid Labor
As documented in Section 4.1, the Time Use Survey (TUS) 2024 shows a stark gender gap in how unpaid domestic and care work is distributed, with women bearing the overwhelming share of these responsibilities. Women spend roughly three to four times more daily time on unpaid household work and caregiving than men (NSO, 2025). Participation rates further underscore this gendered pattern: 81.5% of women engage in unpaid domestic services on any given day compared with 27.1% of men, and 34% of women participate in caregiving compared to 17.9% of men. These figures demonstrate not only a quantitative gap in hours but also a qualitative difference in gender roles and expectations within households.
This gender gap is not just a national statistical curiosity; it fits into broader patterns of gender inequality observed globally. The World Inequality Report 2025 highlights that when unpaid work is taken into account, women’s effective hourly earnings fall even further relative to men’s. Excluding unpaid work, women earn about 61% of men’s hourly wage; including unpaid domestic and care labour, this figure drops to about 32% (Chancel et al., 2025). This means that women’s contribution in both paid and unpaid work is undervalued relative to men’s in income metrics and labour market statistics.
The gendered distribution of unpaid labour has clear implications for economic and social outcomes. As the TUS 2024 data show, for women aged 15 59, high unpaid work hours are accompanied by low rates of paid employment participation: only about 24.9% of women in this age group participate in paid work, compared with 75% of men (NSO, 2025). This gap in access to paid work correlates strongly with the burden of household labour, as women have less time for job search, skills acquisition, education, or formal employment due to domestic responsibilities (ILO, 2018; Alonso et al., 2019).
Globally, unpaid care work is recognised as a key driver of gender inequality. The World Inequality Report notes that unequal unpaid labour contributes to wider labour market disparities, including lower labour force participation, wage gaps, and reduced hours in paid employment patterns observed across many countries and visible in the Indian context as well (Chancel et al., 2025; Elson, 2017). Taken together, TUS 2024 and global inequality evidence show that the burden of unpaid work is both large and deeply gendered. Women’s disproportionate share of household labour is linked to broader structural inequalities in the economy and labour market, reinforcing patterns of unequal access to paid work, lower measured earnings, and reduced economic autonomy.
5.4 Implications for Female Labor Force Participation
The Time Use Survey (TUS) 2024 evidence is consistent with a binding “time constraint” as one major channel behind India’s low female participation in paid work. Among persons aged
15 59 years, only 24.9% of women participated in paid employment and related activities on the reference day, compared to 74.5% of men. Among those participating, women spent 305 minutes per day in paid work, while men spent 421 minutes per day (NSO, 2025).
At the same time, as detailed in Sections 4.1 and 5.3, women devote substantially more time to unpaid household production spending roughly three to four times more daily time on unpaid domestic services and caregiving than men. Participation rates show a similarly wide gender gap across both categories. Taken together, these patterns indicate that women face a systematic “double load”: lower engagement in paid work combined with substantially higher involvement in unpaid domestic and care responsibilities (NSO, 2025; ILO, 2018).
This time burden plausibly operates through several practical mechanisms. Greater time spent on cooking, cleaning, and care reduces the time available for job search, commuting, skill acquisition, and regular full time work (Alonso et al., 2019). It also raises the likelihood of employment patterns that are difficult to sustain short hours, home based work, or frequent interruptions which are typically associated with lower pay and weaker job security. These dynamics align with broader labour economics accounts of India, where gendered norms assign primary responsibility for domestic care to women and thereby shape employment outcomes (Hirway, 2015; Hirway & Jose, 2011).
Recent global inequality evidence further strengthens this interpretation by showing that women’s disadvantage becomes substantially larger once unpaid work is incorporated. The World Inequality Report 2025 notes that excluding unpaid work, women earn about 61% of men’s hourly earnings per working hour, but when unpaid labour hours are included, women’s earnings fall to 32% of men’s (Chancel et al., 2025). This matters for labour force participation because it shows that conventional paid work indicators understate women’s total work contribution and can misclassify heavy work, low autonomy time allocations as “economic inactivity.”
Indian time use research based on the 2019 Time Use Survey similarly documents the disproportionate unpaid burden on women and frames it as a trade off with paid work, mediated by norms and household responsibilities (NSO, 2020). While that evidence uses the earlier survey round, TUS 2024 confirms that the gender gap in unpaid work remains large, so the underlying constraint remains relevant.
Overall, the implication is not that unpaid work alone “causes” low female labour force participation. Participation is shaped by multiple factors: education, local job availability, wages, safety, transport, and norms. However, the TUS 2024 data show that women’s unpaid domestic and care workload is high and widespread, and this is logically consistent with the large observed participation gap in paid work. In policy terms, strategies to raise female labour force participation must address unpaid work directly through childcare and eldercare services, basic infrastructure that reduces drudgery, and credible shifts that increase men’s participation in household labour because time is the binding resource (Elson, 2017; ILO, 2018).
5.5 Conceptualizing a Household Production Satellite Account
The findings of this study raise a clear accounting question: if unpaid domestic and care work creates large economic value, how can it be recognised in statistics without changing official GDP? The standard response in national accounting is to use a household production satellite account.
Under the System of National Accounts (SNA), GDP is deliberately limited to market production and selected non market services provided by government and non profit institutions. Unpaid domestic and care services produced and consumed within households such as cooking, cleaning, and caring for family members are explicitly kept outside the core production boundary. This is not because these activities are “worthless”, but because they are difficult to price consistently and compare across countries in a way that keeps headline GDP comparable.
A satellite account is designed to solve exactly this problem. It measures additional forms of production “alongside” the main national accounts, without altering official GDP. In practical terms, a household production satellite account would record unpaid domestic and care work as an extra layer of economic activity, using transparent valuation rules and clearly stated assumptions, while keeping the official GDP series unchanged.
International statistical standards already support this idea. The 1993 and 2008 SNA revisions explicitly encourage satellite accounts for unpaid household production using time use data and standard valuation approaches such as replacement cost and opportunity cost. Several countries have produced such satellite accounts on an experimental or regular basis showing that it is possible to make unpaid work visible in official statistical outputs without diluting the meaning of GDP.
In the Indian context, the basic building blocks already exist. The National Statistical Office has conducted Time Use Surveys (2019 and 2024), which provide nationally representative measurement of unpaid domestic and care work time. Ministry of Statistics and Programme Implementation surveys and labour market datasets such as PLFS provide the wage benchmarks needed for valuation. Using these official inputs, this report constructs 2026 “Housewife GDP” valuations for a clearly defined population: adult women (18+) whose PLFS principal status is domestic duties (codes 92+93). Under this definition, the primary time based valuations fall in the range of about 22.5 38.1 lakh crore, depending on whether we use a generalist or specialist replacement benchmark, which corresponds to roughly 6.3% 10.7% of nominal GDP (FY 2025 26).
A household production satellite account for India can be structured in a clean, auditable way. First, inputs: unpaid work time from the Time Use Survey. Second, valuation: opportunity cost and replacement cost reported as ranges (not a single fragile number), with the wage benchmarks and working time conventions stated upfront, while being careful about double counting.
This structure makes unpaid work measurable and comparable over time without mixing it into headline GDP.
Importantly, recognizing unpaid work through a satellite account does not mean it should be taxed, monetised, or forced into markets. The purpose is visibility and better measurement not turning households into firms. A satellite account helps policymakers see how public investments in childcare, water, cooking fuel, sanitation, and eldercare can reduce unpaid time burdens, and how that connects to women’s labour force participation and household welfare.
In summary, the results of this study fit naturally into a household production satellite account framework. Such an approach would preserve the integrity of official GDP while making visible a large and economically meaningful domain of work that currently sits outside headline indicators improving how we analyse labour allocation, gender gaps, and the true structure of economic activity in India.
6. Policy Implications
6.1 Recognizing Unpaid Labor in Economic Indicators
The findings of this study show that unpaid domestic and care work performed by “housewives” in India has a large economic value even under conservative assumptions. Using our project definition of adult women (18+) whose PLFS principal status is domestic duties (codes 92+93) the time based valuations for 2026 fall in the range of 22.5 38.1 lakh crore, which is about 6.3% 10.7% of nominal GDP. Despite this scale, unpaid work remains outside GDP and is also largely invisible in standard employment statistics, creating a gap between measured economic activity and the real work that keeps households running.
A clear policy implication is the need to recognise unpaid household production in official statistics without changing headline GDP. The internationally accepted way to do this is to build a Household Production Satellite Account under the SNA 2008 framework. A satellite account reports unpaid household production alongside GDP (with transparent methods and assumptions), while keeping official GDP comparable across countries.
India is well placed to implement this. The National Statistical Office has already produced nationally representative Time Use Surveys (2019 and 2024). Combined with wage benchmarks from labour force surveys such as the Periodic Labour Force Survey, these datasets are sufficient to publish regular, repeatable estimates of unpaid household production using standard methods (opportunity cost and replacement cost), with clear ranges rather than a single fragile number.
Recognising unpaid work in this way also aligns with SDG 5.4, which calls for recognising and valuing unpaid care and domestic work through public services, infrastructure, and social protection. Regular reporting would strengthen gender responsive budgeting and make it easier to evaluate policies that reduce unpaid time burdens such as childcare expansion, water and sanitation access, and eldercare support using measurable economic indicators rather than assumptions.
6.2 Strengthening Childcare, Eldercare, and Public Service Infrastructure
A clear policy implication of this study is the need for stronger care related infrastructure that reduces the unpaid work burden that falls disproportionately on women. The time use evidence shows that a meaningful part of women’s unpaid workload comes from caregiving looking after children, older family members, or anyone in the household who needs support. Expanding access to affordable childcare centres, preschools, and elder day care facilities can reduce the daily time pressure on households and make it easier for women to take up paid work, training, or education if they choose.
The economic logic is straightforward. In this report, the unpaid work done by the PLFS domestic duties cohort (18+) is valued at roughly 6% 11% of GDP depending on the method used. Even small reductions in the time burden through reliable childcare, elder support services, better water access, sanitation, and clean cooking infrastructure can create real economic gains. The gain is not from “pricing” all household work, but from freeing up time so households have more options: more paid work, more skill building, or simply less time stress.
International experience supports this direction. Countries with widespread, affordable child- care and eldercare services tend to have higher female participation in paid work and lower work interruptions due to care responsibilities. For example, Sweden combines high childcare coverage with high women’s labour force participation, showing how care services can function as economic infrastructure, not just welfare support. The exact outcomes depend on labour market conditions and social norms, but the direction is consistent: when care systems work, women’s economic choices expand.
Overall, strengthening childcare, eldercare, and basic household infrastructure addresses a key constraint highlighted by time use data: women’s time is heavily committed to unpaid work. Reducing that burden improves household wellbeing, expands feasible labour market choices, and supports more inclusive growth.
6.3 Reducing Time Poverty Through Technology and Access
Another important policy implication is the need to reduce women’s time poverty by improving access to basic services and labour saving tools. “Time poverty” means a person’s day is heavily consumed by routine unpaid tasks, leaving little time for paid work, learning, rest, or leisure. The Time Use Survey (TUS) 2024 supports this concern: women spend large amounts of time on unpaid domestic work every day, which limits how flexible their time choices can be.
Public investment in piped water, sanitation, clean cooking fuel, electricity, and transport can reduce the time and physical effort needed for daily household work. In many places, gaps in basic services mean routine tasks take longer than they otherwise would for example, when water access is unreliable or cooking relies on inefficient fuels. Weak local transport can also increase the time cost of everyday household and care responsibilities.
Government programmes such as Jal Jeevan Mission, Swachh Bharat Mission, and Pradhan Mantri Ujjwala Yojana can be viewed through this lens. Beyond health and welfare benefits, these interventions can reduce drudgery and lower the time burden of routine household tasks. When basic services improve, households are able to reallocate time more freely toward paid work, education, rest, or caregiving that is chosen rather than forced by constraints.
Access to household technologies such as washing machines, pressure cookers, and clean energy appliances also matters, especially in urban and semi urban areas. These tools do not remove unpaid work, but they often reduce the time and effort required to do it. In practical terms, they expand a woman’s usable “time budget” and reduce the daily intensity of household labour.
Overall, reducing time poverty through infrastructure and technology is a non coercive way to improve women’s economic opportunity. Instead of forcing labour market outcomes, it relaxes the binding constraint that matters most in daily life: not enough time.
6.4 Redistribution of Domestic Work and Social Norms
Reducing women’s unpaid work burden requires not only better public services and infrastructure, but also more equal sharing of domestic and care work within households. The Time Use Survey (TUS) 2024 shows a clear gap: men spend much less time than women on unpaid domestic work and caregiving. This reflects social norms in many families where household responsibilities are seen mainly as women’s work.
Policy can help shift these norms over time. Public awareness campaigns and school based education can support the idea that cooking, cleaning, and caregiving are shared responsibilities. Behaviour change is usually slow, but even a gradual rise in men’s participation can reduce women’s daily time pressure and give them more time for paid work, study, or rest.
Workplace policies also matter because they shape what families see as “normal.” Steps such as paternity leave, flexible work arrangements, and recognising caregiving as a shared responsibility can reduce the default assumption that care is a woman’s role. These policies can also reduce employer bias by signalling that caregiving responsibilities exist for both men and women.
Overall, redistribution inside the home is a necessary complement to investments in childcare, eldercare, infrastructure, and labour saving tools. If domestic work is not shared more fairly, women may remain time constrained even when public services improve.
6.5 Directions for Legislative or Welfare Support
The findings of this study also matter for welfare policy and social protection. When we recognise the value of unpaid domestic and care work, we get a clearer picture of how households actually function. Many families especially lower income families depend heavily on services produced inside the home, such as cooking, cleaning, and caring for children or elders. If this unpaid production is ignored, income only measures can miss an important part of day to day living. This does not remove material hardship, but it helps explain why income alone is not a complete picture of well being.
At the same time, welfare and livelihood programmes should not unintentionally increase women’s unpaid workload. Some interventions such as home based production, self employment promotion, or microcredit linked activities can add work hours without reducing domestic responsibilities. If support systems are missing (childcare, transport, water, clean fuel, local services), these programmes can intensify time poverty even when they raise income. Good design therefore needs to track time use alongside income outcomes.
There is also scope for limited and targeted policy recognition of unpaid work. A universal “wage for housework” is unlikely to be practical at scale, but governments can consider narrower, workable options such as caregiver allowances for high need households, pension credits for years spent out of paid work due to caregiving, health insurance coverage for homemakers, or easier access to social security schemes. These steps recognise unpaid care as socially necessary work without turning it fully into a market job.
Overall, the policy direction implied by this study can be summarised in three actions: recognise, reduce, and redistribute unpaid work. Recognition means measuring it and reporting it clearly (for example, through satellite accounts). Reduction means lowering the time burden through infrastructure, technology, and care services. Redistribution means sharing domestic work more evenly within households and expanding institutional support. Over time, if more care becomes shared, organised, or supported through services, the “unpaid” part may shrink which would be a sign of progress, because it would expand women’s choices and strengthen the formal economy rather than simply shifting numbers in an accounting table.
7. Conclusion
7.1 Summary of Findings
This study shows that unpaid domestic and care work in India is still overwhelmingly carried out by women. Evidence from the Time Use Survey (TUS) 2024 indicates that women (aged 6 years and above) spend, on average, 289 minutes per day on unpaid domestic services such as cooking, cleaning, and routine household chores, compared to 88 minutes per day for men. For unpaid caregiving, the survey reports that women spend about 137 minutes per day and men about 75 minutes per day. Participation patterns show the same imbalance: 81.5% of women reported doing unpaid domestic services on the reference day versus 27.1% of men, and 34.0% of women reported unpaid caregiving versus 17.9% of men. These figures point to a persistent gender gap in both time burden and responsibility within households.
Building on this time use evidence, the report estimates the economic value of unpaid domestic and care work for a clearly defined “Housewife GDP” population. In this report, the population is defined using PLFS usual principal status codes: Code 92 (domestic duties only) and Code 93 (domestic duties plus free collection of goods for household use). Using the 2026 baseline established earlier, the projected homemaker cohort is 211.15 million adult women (18+) in codes 92 and 93. Because the valuation is anchored to this defined homemaker cohort, the resulting GDP shares should be interpreted as estimates for this group rather than for all unpaid work performed across the full population.
Using MoSPI’s First Advance Estimates for FY 2025 26, India’s nominal GDP is 357.14 lakh crore. On this base, the opportunity cost method values unpaid domestic and care work at 22.81 lakh crore, which is about 6.39% of GDP. The generalist replacement cost method, which treats household work as a bundle that could be replaced by a single domestic worker paid on a monthly basis, gives a similar estimate of 22.51 lakh crore, or 6.30% of GDP. The specialist replacement cost method, which values major household tasks using higher task specific market rates, yields a higher estimate of 38.12 lakh crore, or 10.67% of GDP. The spread across these figures is expected: each method measures a different economic concept, so the results should be read as a range rather than a single “true” number. Taken together, the findings support a clear conclusion. Even under conservative assumptions and a carefully defined homemaker population, unpaid domestic and care work represents a large volume of economic activity that remains outside standard GDP measurement. The work done inside households sustains daily living, supports children and the elderly, and makes regular paid work possible. The estimates are best interpreted as satellite account magnitudes: they do not propose changing official GDP, but they do show that ignoring unpaid household production leads to a major blind spot in how economic activity and labour contributions are understood.
7.2 Contributions of the Study
This study makes three core contributions to research and policy discussions on unpaid work and economic measurement in India.
First, it anchors the analysis in India’s most recent official time use evidence. Using the Time Use Survey (TUS) 2024, the study documents the scale of unpaid domestic and care work and the size of the gender gap in time allocation. This provides a current, nationally representative picture of how unpaid work is distributed and why it continues to shape women’s time budgets and economic choices.
Second, the study brings multiple valuation methods into one consistent framework and reports them as a range rather than a single headline number. It presents the opportunity cost estimate and two replacement cost variants (generalist and specialist). Placing these approaches side by side makes the assumptions transparent especially wage benchmarks, task coverage, and pricing logic and helps readers understand why different methods produce different totals. In simple terms, each method answers a different question: the opportunity cost method measures income forgone and the replacement cost method measures what it would cost to hire paid services.
Third, the study connects measurement to national accounting practice in a policy usable way. Official GDP excludes unpaid household services for reasons of valuation difficulty and international comparability, but the UN System of National Accounts recognises that these activities can be measured through household production satellite accounts. By framing “Housewife GDP” as a satellite account style estimate built from official Indian surveys and stated assumptions the study shows how unpaid work can be made visible in economic reporting without changing official GDP or weakening its comparability.
Together, these contributions strengthen the empirical base, improve methodological clarity, and align the discussion with established accounting principles. The result is a framework that measures unpaid work rigorously, explains it in a way non specialists can follow, and remains feasible for policy analysis and statistical reporting.
7.3 Limitations of the Study
The findings in Sections 4 6 are based on official data and transparent assumptions; they should be read with some important limits in mind.
First, the values in this study are imputed estimates, not actual income earned. They show the economic value of unpaid time and services, not cash received by households.
Second, time use data has natural limitations. The Time Use Survey is based on diary style reporting for a reference day, so small reporting errors can happen. Some regular household tasks may be forgotten or under reported because they are routine and do not stand out.
Third, the main estimates combine two different official sources: TUS is used for time spent on unpaid work, while PLFS is used to identify the “housewife” population (codes 92 and 93). Since these are separate surveys, the results should be treated as careful order of magnitude estimates, not exact accounting totals.
Fourth, the results are sensitive to wage and price assumptions. There is no single “correct” wage for unpaid work, because the market value of the same task can differ across states, rural and urban areas, and formal and informal work arrangements. This is why the study reports a range of estimates (opportunity cost, generalist replacement cost, and specialist replacement cost) instead of one headline number.
Finally, this study focuses only on unpaid domestic and care services produced within one’s own household. It does not include unpaid work in family farms or household enterprises, because those activities are often closer to market production and may already be captured in GDP through other channels.
Even with these limits, the approach remains useful because it is transparent, replicable, and grounded in official time use evidence. It provides a disciplined way to show the scale of house- hold production that standard GDP accounting leaves out.
7.4 Pathways for Future Research
This study is a starting point, not the final word on valuing unpaid domestic and care work in India. There are several clear next steps that can strengthen measurement quality and make the results more useful for policy design and evaluation.
Tracking change over time. Future work should repeat these estimates using successive rounds of the Time Use Survey. Doing this regularly would show whether unpaid work is declining, staying stable, or shifting across tasks as incomes rise, female labour force participation changes, and household norms evolve.
Improving time use measurement. Later Time Use Surveys can be improved by capturing multitasking, secondary activities, and “care supervision” more clearly (for example, looking after a child while cooking). Adding simple indicators of burden such as physical strain, mental load, or task difficulty would help measure not just hours, but how demanding unpaid work is.
Understanding distributional patterns. Linking time use data with household income and consumption surveys would allow analysis of how unpaid work value differs across income groups, regions, and life stages. This would also help answer a policy relevant question: how inequality looks when household production is included alongside money income and consumption.
Men’s participation in unpaid work. This study focuses mainly on women because they carry most unpaid work, but future research should study men’s unpaid work in more detail. Understanding what increases men’s participation and what that changes for women’s paid work, time use, and household welfare would support better policy design. Pilot studies and behavioural research could be useful here.
Rural livelihoods and dual work roles. In rural India, women often combine domestic work with unpaid family work, especially in agriculture. Future studies should examine seasonal patterns, how mechanisation affects workloads, and how shifts in rural livelihoods change women’s total work burden across the year.
Technology and automation. Household appliances, digital services, and new technologies can reduce some types of unpaid work while changing others. Studying which technologies actually save time and for whom would help target interventions that reduce time poverty in a measurable way.
Macroeconomic models and policy evaluation. A longer term goal is to build models that include household production explicitly. This would allow simulation of policy scenarios such as expanded childcare, eldercare services, or higher female labour force participation and their impact on both measured GDP and extended output that includes household production. Cross country comparison and impact evaluations using unpaid work indicators as outcomes can also identify which policies reduce unpaid work burdens most effectively.
Overall, the goal is not just to produce a single “Housewife GDP” estimate. The goal is to build a measurement system where unpaid domestic and care work is consistently visible in economic analysis, valued with transparent methods, and used to design policies that reduce burdens and support fairer sharing of care responsibilities.
References
Alonso, C., Brussevich, M., Dabla Norris, E., Kinoshita, Y., & Kochhar, K. (2019). Reducing and redistributing unpaid work: Stronger policies to support gender equality (IMF Work- ing Paper No. 19/225). International Monetary Fund. https://www.imf.org//media/ files/publications/wp/2019/wpiea2019225printpdf.pdf
Asia Pacific Economic Cooperation. (2022). Unpaid care and domestic work: Counting the costs. APEC Policy Support Unit. https://www.apec.org/publications/2022/03/ unpaidcareanddomesticworkcountingthecosts
Becker, G. S. (1965). A theory of the allocation of time. The Economic Journal, 75(299), 493 517. https://doi.org/10.2307/2228949
BookMyBai. (2025). Our charges [Web page]. BookMyBai Services Pvt. Ltd. https://www. bookmybai.com/ourcharges.aspx
Budlender, D. (2010). What do time use studies tell us about unpaid care work? In Time use studies and unpaid care work (pp. 1 45). Routledge. https://doi.org/10.4324/ 9780203847580
Central Statistical Organisation. (2000). Report of the Time Use Survey. Ministry of Statistics and Programme Implementation, Government of India. https://www.mospi.gov.in/sites/default/files/publication_reports/Report%20of%20the%20Time%20Use%20SurveyFinal.pdf
Chancel, L., Piketty, T., Saez, E., & Zucman, G. (2025). World Inequality Report 2025. World Inequality Lab. https://wir2025.wid.world
Elson, D. (2017). Recognize, reduce, and redistribute unpaid care work: How to close the gender gap. New Labor Forum, 26(2), 52 61. https://journals.sagepub.com/doi/ abs/10.1177/1095796017700135
Folbre, N. (2006). Measuring care: Gender, empowerment, and the care economy. Journal of Human Development, 7(2), 183 199. https://doi.org/10.1080/14649880600768512
Hirway, I. (2015). Unpaid work and the economy: Linkages and their implications. The Indian Journal of Labour Economics, 58(1), 1 21. https://link.springer.com/article/10. 1007/s4102701500103
Hirway, I., & Jose, S. (2011). Understanding women’s work using time use statistics: The case of India. Feminist Economics, 17(4), 76 92. https://doi.org/10.1080/13545701.2011.622263
International Labour Organization. (2016). Women at work: Trends 2016. ILO Publications. https://www.ilo.org/publications/majorpublications/womenworktrends2016
International Labour Organization. (2018). Care work and care jobs for the future of decent work. ILO Publications. https://www.ilo.org/publications/majorpublications/ careworkandcarejobsfuturedecentwork
International Labour Organization. (2022). ILOSTAT: Labour force participation rate, female India [Data set]. ILOSTAT. https://ilostat.ilo.org/data/
Ironmonger, D. (1996). Counting outputs, capital inputs and caring labor: Estimating gross household product. Feminist Economics, 2(3), 37 64. https://doi.org/10.1080/13545709610001707756
JobNukkad. (2025). Maid salary in Mumbai, Thane: Part time and full time [Web page].
JobNukkad. https://jobnukkad.com/fulltimemaidsalaryinmumbai
Mehta, A. K., & Pratap, S. (2017). Exploring the possibility of estimating women’s contribution to GDP. National Commission for Women, Government of India.
Ministry of Statistics and Programme Implementation. (2023).Women and men in India 2023: Population. National Statistical Office, Government of India. https://mospi.gov.in/sites/default/files/reports_and_publication/statistical_publication/Women_Men/mw23/Population.pdf
Ministry of Statistics and Programme Implementation. (2024). Annual report: Periodic Labour Force Survey (PLFS), July 2023 June 2024. National Statistical Office, Government of India. https://www.mospi.gov.in/sites/default/files/press_release/Press_ note_AR_PLFS_2023_24_22092024.pdf
Ministry of Statistics and Programme Implementation. (2026). Press note on First Advance Estimates of GDP for FY 2025 26. National Statistical Office, Government of India. https://www.mospi.gov.in/uploads/latestReleases/latest_release_ 1767781372753_1380ce82f5a5440d99e6e6b35af0deb5_GDP_Press_Note_on_FAE_ 202526.pdf
National Sample Survey Office. (2017). Periodic Labour Force Survey: Schedule 10.4 First visit [Survey instrument]. Ministry of Statistics and Programme Implementation, Government of India. https://mospi.gov.in/sites/default/files/publication_ reports/PLFS_10.4_1stVisit.pdf
National Statistical Office. (2020). Time use in India 2019. Ministry of Statis- tics and Programme Implementation, Government of India. https://mospi.gov.in/timeusesurvey
National Statistical Office. (2023). Annual report: Periodic Labour Force Survey (PLFS), July 2022 June 2023. Ministry of Statistics and Programme Implementation, Government of India. https://www.mospi.gov.in/sites/default/files/publication_reports/ AR_PLFS_2022_23N.pdf
National Statistical Office. (2025). Time Use Survey, 2024: Fact sheet (January De- cember, 2024). Ministry of Statistics and Programme Implementation, Government of India. https://www.mospi.gov.in/sites/default/files/publication_reports/ TUS_Factsheet_25022025.pdf
Nikore, M. (2022). Building India’s economy on the backs of women’s unpaid work: A gendered analysis of time use data (ORF Occasional Paper No. 372).
Observer Research Foundation. https://www.orfonline.org/research/ buildingindiaseconomyonthebacksofwomensunpaidworkagenderedanalysisoftimeusedata
Nordhaus, W. D., & Tobin, J. (1973). Is growth obsolete? In M. Moss (Ed.), The measurement of economic and social performance (pp. 509 564). National Bureau of Economic Research. https://www.nber.org/system/files/chapters/c7620/c7620.pdf
Paycheck.in. (2025). Minimum wage Bihar, domestic workers [Web page]. WageIndi- cator Foundation. https://paycheck.in/salary/minimumwages/14589bihar/ 15034domesticworkers
Sahoo, S., Sarkar, K. K., & Kumar, A. (2024). Valuation of unpaid household activities in India. Economic and Political Weekly, 59(39). https://www.epw.in/journal/2024/ 39/specialarticles/valuationunpaidhouseholdactivitiesindia.html
SBI Research. (2023). EcoWrap (Issue No. 60, February 28). State Bank of India. https://sbi.co.in/documents/13958/25272736/010323Ecowrap_20230228.pdf
United Nations Department of Economic and Social Affairs. (2025, October 23). Invisible yet indispensable: Why the world runs on women’s un- paid care work. https://social.desa.un.org/worldsummit2025/blog/invisibleyetindispensablewhytheworldrunsonwomensunpaidcarework
United Nations Economic Commission for Europe. (2017). Guide on valuing unpaid house- hold service work. United Nations. https://www.unilibrary.org/content/books/ 9789213627921
United Nations Statistics Division. (2008). System of National Accounts 2008. United Nations. https://unstats.un.org/unsd/nationalaccount/sna2008.asp
van de Ven, P., Zwijnenburg, J., & De Queljoe, M. (2018). Including unpaid household activities: An estimate of its impact on macro economic indicators (SDD Working Paper No. 91). OECD. https://www.oecd.org/en/publications/includingunpaidhouseholdactivities_bc9d30dcen.html
WageIndicator Foundation. (2025). Minimum wage Residential houses including domestic helpers, Karnataka [Web page]. WageIndicator. https://wageindicator.org/salary/minimumwage/india/31024karnataka/32121residentialhousesincludingdomestichelpers
Waring, M. (1988). If women counted: A new feminist economics. Harper & Row.
World Bank. (2022). Labour force participation rate, female (% of female population ages 15+) India [Data set]. World Bank Open Data. https://data.worldbank.org/indicator/ SL.TLF.CACT.FE.ZS?locations=IN