

Claim: An article published by online portal Scroll, claims that middle-class incomes have stagnated at ₹10.5 lakh with a sharp fall in purchasing power, household debt is rising dangerously, and household savings have fallen significantly.

Our examination found the claim to be MISLEADING.
How We Examined the Claim:
1. We examined the claim that middle-class income has stagnated at 10.5 lakhs per annum for the calculation methodology and statistical validity. To calculate the income growth of any group from 2014 to 2024, we would have to track the income of the same group of people we selected in 2014.
We found that the Scroll article fails in this basic mathematical condition and uses a different set of individuals to calculate the average income in 2024 (people falling in 5 to 30 lakh income range in 2024 would be different from the people falling in the same range in 2014).
As this base calculation is invalid, the author’s subsequent analyses about loss of purchasing power etc. are also invalid.
2. To check the Scroll article’s claim of a “dangerous trend in household debt,” we looked at the actual data. The article highlights a rise in household debt from 23.1% to 23.9% of GDP between FY24 and Q1 FY25, calling it alarming.
The Scroll selectively includes personal loans and excludes other types of borrowing.
Using the overall debt figures, as used by The Reserve Bank of India, we see that the total household debt is at around 43% of GDP.
To put a context to this number, we look at global numbers and find that India’s debt ratio is amongst the lowest across countries. The data is provided in the table.
| Country | Household Debt-to-GDP (%) | Per Capita Debt (USD) | Debt-to-Income Ratio (%) |
| United States | 73 | 65,175 | 73.14 |
| China | 61 | 8,365 | 61.1 |
| Germany | 55.6 | 31,090 | 55.61 |
| India | 42.6 | 1,246 | 43.26 |
| Japan | 61.8 | 19,564 | 61.76 |
| United Kingdom | 82.5 | 45,310 | 82.46 |
| France | 65.8 | 30,556 | 65.77 |
| Italy | 45 | 1,727 | 45.07 |
| Canada | 113.2 | 60,630 | 113.2 |
| Brazil | 44.2 | 4,397 | 44.15 |
While the Scroll article calls the rise in household debt a “dangerous underlying trend,” it must be noted that even the Morgan Stanley report quoted by the article itself says that while debt is rising, it remains manageable and does not signal a crisis.
The Morgan Stanley report, as cited in The Indian Express, clearly states that while India’s household debt is increasing, it remains manageable and is structurally lower than in most developed economies. The report does highlight a decline in household savings as a concern, but nowhere does it describe the situation as dangerous or a crisis. Scroll’s choice of language exaggerates the risk far beyond what the data and their own sources actually support.
3. The Scroll article includes a graph titled “Year-on-Year Decline in Savings”. This graph depicts selective Net Financial Asset Numbers published by RBI from time to time. We checked NFA definition used by RBI and then examined the graph for logical consistency. Net Financial Asset (NFA) is defined as Cash plus Bank Deposits plus Equity Linked Investments minus all Loans and Debt taken. While the article treats NFA as a measure of savings, this is a fundamental error.
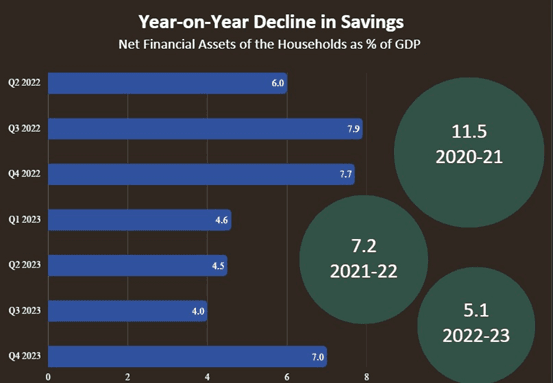
NFA completely ignores physical or non-financial assets like real estate, gold, and durable goods, which are among the most common outcomes of household saving.
When people use their financial assets or take loans to buy such assets, their liquid financial position on paper weakens, but their actual wealth rises. NFA fails to capture this shift, making it a distorted and misleading measure of savings.
Take a simple example. A household with ₹10 lakh in financial assets and no debt has an NFA of ₹10 lakh. If it uses this ₹10 lakh as a down payment for a ₹40 lakh house and takes a ₹30 lakh loan, its financial assets drop to zero and liabilities rise to ₹30 lakh.
Its NFA becomes negative ₹30 lakh. But it now owns a house worth ₹40 lakh. The household is clearly wealthier, yet NFA suggests it is worse off. This distortion shows why NFA is not a true reflection of savings. It captures net financial liquidity, not actual asset accumulation.
It might be useful for judging short-term solvency, but it is entirely inadequate for understanding long-term saving behavior or real household wealth. Any meaningful assessment of savings must include both financial and physical assets.
Conclusion:
he Scroll article claims are not backed by official data. Average income calculation uses a flawed methodology that will always show the same average income for “middle-class” irrespective of the year used. As the average income calculation is wrong, the other assertions about falling purchasing power of middle class etc. are also invalid. Household debt is rising in accordance with economic growth and remains manageable by global standards.
The Scroll article’s alarmism is rejected by the very sources they have quoted. The article also misrepresents Net Financial Assets data to indicate household savings. This mischaracterization is categorically rejected by the definition of NFA used by RBI. The article uses selective data and strong language to paint a picture of crisis. This picture gets easily rejected by careful scrutiny.
Therefore, the claims quoted from the article are Misleading.