
Executive Summary
The implementation of the Goods and Services Tax (GST) on July 1, 2017, marked a decisive structural break in India’s logistics system, transitioning it from a fragmented network of state- level levies and physical chokepoints to a unified national market. By abolishing inter-state check- posts and replacing paper-based enforcement with a digital compliance framework, namely the E- way bill and FASTag, the reform fundamentally re-engineered the mechanics of goods movement. This shift resulted in a significant productivity leap, with average daily truck distances increasing from 225 km to approximately 300–325 km, alongside an 18–20% reduction in truck turnaround times. These efficiency gains triggered a “cost of capital” release mechanism, allowing firms to consolidate warehousing, reduce inventory levels by up to 30%, and improve inventory turnover by 40%, thereby freeing substantial working capital.
Beyond operational metrics, GST has functioned as a critical macroeconomic stabiliser and a buffer against inflation. While logistics costs were historically estimated at 13–14% of GDP, recent data indicate a moderation to 7.97% of GDP for FY 2023-24, reflecting the erosion of the “friction pre- mium” previously embedded in Indian goods. During the COVID-19 pandemic, this digital-first infrastructure served as a stress-tested backbone, enabling a rapid V-shaped recovery in freight volumes and preventing the localised scarcity premiums that drove supply-chain inflation in many advanced economies. Despite high diesel price volatility, the efficiency gains from GST-era re- forms prevented a sharper rise in retail prices by absorbing cost shocks that would otherwise have been passed through to consumers. Ultimately, while a gap remains between the national aver- age and the “frontier” efficiency of 500+ km/day achieved by technology-led operators, GST has provided the institutional foundation for sustained, scalable growth in India’s logistics sector.
Introduction
The implementation of the Goods and Services Tax (GST) on July 1, 2017, marked a watershed moment in India’s economic history, representing not merely fiscal consolidation but a fundamental re-engineering of the nation’s supply chain architecture. To fully appreciate the magnitude of this structural break, it is imperative to reconstruct the pre-GST equilibrium, a period characterised by high frictional costs, fragmented markets, and sub-optimal asset utilisation.
Prior to 2017, the Indian logistics sector operated within a distorted framework where tax avoidance often dictated supply chain design. The prevalence of state-level levies such as Value Added Tax (VAT), Central Sales Tax (CST), Octroi, and Entry Tax created a system in which India functioned less as a single common market and more as a loose federation of distinct economic zones, each guarded by physical check posts. These borders were not merely administrative formalities; they were significant chokepoints that imposed severe penalties on the velocity of trade.
The economic cost of this fragmentation was substantial. Historically, logistics costs in India were estimated at 13% to 14% of GDP, a figure significantly higher than the 8% to 10% observed in developed economies such as the United States and Europe.1 This inefficiency was not purely a function of poor physical infrastructure; a significant portion was attributable to “administrative friction”, the idle time spent by trucks at state borders for document verification and tax compliance. Reports indicate that truckers spent 3 to 6 hours at a single checkpoint, with variability up to 24 hours in extreme cases.2
This report provides an exhaustive analytical examination of how the GST regime dismantled these barriers. It explores the mechanism through which the removal of physical friction translated into higher logistics velocity, quantified by improvements in Truck Turnaround Time (TAT) and daily distance covered. Furthermore, it posits a “Cost of Capital” mechanism, arguing that the reduction in transit time effectively released working capital trapped in the supply chain, generating measurable savings in opportunity costs. Finally, the analysis evaluates the transmission of these efficiency gains into broader inflation dynamics, using the COVID-19 pandemic as a stress test to compare India’s supply chain resilience against global benchmarks.
Logistics Speed and Transit Time: Pre- vs. Post-GST Metrics
The most immediate and empirically verifiable impact of GST was the abolition of state border check-posts. This policy action removed the primary source of variable delay in inter-state transport, allowing for a structural upward shift in logistics velocity.
In the pre-GST era, the operational efficiency of the Indian trucking sector was severely con- strained. The average distance a truck covered was approximately 225 km/day.3 This low mileage was not solely a result of road conditions but was significantly influenced by the “stop-and-go” nature of compliance. Trucks were forced to queue at state borders for scrutiny by Commercial Tax Departments, RTOs, and excise squads.
Post-GST, the removal of these check-posts, coupled with the introduction of digital compliance mechanisms like the E-way bill, fundamentally altered this metric. Data from the Ministry of Road Transport and Highways (MoRTH) and NITI Aayog indicate that the average daily distance covered by trucks increased to 300-325 km.4 This represents a productivity leap of approximately 33% to 44%.5
Evidence on Turnaround Time (TAT) and the Digital Backbone That Sustained It
The post-GST reduction in transit time is supported by strong empirical evidence, and it becomes even more convincing when read alongside the digital systems that later “locked in” these gains. ICRA study on the road logistics industry quantified an 18–20% improvement in truck turnaround
| Metric | Pre-GST | Post-GST | Impact / Change |
| Average Truck Speed | 225 Km/day | 300-325 Km/day | 33% to +44% increase in daily Mileage |
| Border Wait Times | High (3-6Hrs/ Checkpoint) | Minimal (Minutes) | Structural removal of physical check-posts eliminated idle time |
| Turnaround Time (TAT) | High Variability | Reduced by 18-20% | Faster Cycle times improve asset utilisation |
| Check-post Status | Mandatory Stops | Abolished | Elimination of state barriers created a seamless corridor |
time (TAT) after inter-state check-posts were removed.6 Crucially, the gains were not uniform across the country. They were geographically asymmetric, with the sharpest reductions in waiting times occurring in states that had historically suffered from high border friction: Kerala, West Bengal, Maharashtra, Madhya Pradesh, and Bihar.7 This pattern matters because it suggests GST was not merely improving average efficiency; it was specifically dismantling the worst choke- points in the freight network.
Concrete route-level outcomes illustrate the shift. Knight Frank’s warehousing/logistics analysis reports that the Delhi-Chennai journey, which earlier took 5-6 days, fell to about 3-4 days in the post-GST period.8 Logistics aggregators responded quickly to this new environment. Rivigo, for example, leveraged the decline in checkpoint-era uncertainty to pilot “relay trucking” models, claiming Delhi–Mumbai run times of under 24 hours, an operational feat that would have been structurally implausible when border stoppages were routine and unpredictable.9 In other words, GST did not just shave hours off trips; it changed what logistics firms could credibly optimise for, enabling business-model innovation based on speed, predictability, and asset productivity.
That said, these efficiency gains were not absolute across all segments, and the difference between “moving faster” and “utilising better” is analytically important. While “moving time” improved, demand-side constraints sometimes offset the benefits by increasing idle time elsewhere in the system. CRISIL Research observed that although trucks reached destinations sooner, the lack of a concurrent increase in freight demand initially led to longer waits for return loads at transport hubs, contributing to a short-term decline in utilisation rates.10 This distinction clarifies the mechanism: GST directly addressed supply-side frictions of movement (unproductive stoppages), but it could not instantly repair demand-side mismatches (imbalanced flows and backhaul shortages). The reform improved the physics of freight movement; it did not automatically rewire the economics of freight demand.
The long-run sustainability of these speed gains, however, depended on preventing a “return” of friction through enforcement practices, and this is where digital compliance infrastructure becomes central. The Electronic Way Bill (E-way bill) system, introduced in April 2018, replaced fragmented paper trails with a unified digital permit for the movement of goods above Rs. 50,000.11 Its deeper contribution was institutional: it decoupled tax enforcement from physical interception. Instead of routine stoppages as a default enforcement tool, authorities could verify compliance digitally using RFID and FASTag-linked data and reserve physical intervention for cases with specific intelligence signals of evasion.12 This helped preserve the core benefit of GST: fewer discretionary stops and a more predictable corridor for legitimate trade.
FASTag, an electronic toll collection system, further reinforced this trajectory. While toll plazas are not tax check-posts, their automation complements GST by reducing yet another major source of stop-and-go delay. Over time, the combined effect of GST (removal of tax stops) and FASTag (reduction of toll stops) created near-seamless freight corridors. By August 2024, E-way bill generation had crossed 10 crore per month, signalling a high-velocity environment of routine, digitised compliance and large-scale formal movement of goods.13 In short, GST delivered the initial break- through by removing the physical architecture of border friction, and the e-way bill + FASTag stack ensured those gains did not erode by shifting compliance back into predictable, auditable, low-friction digital rails.
The Cost of Capital Mechanism: From Friction to Financial Savings
In logistics economics, time is a proxy for capital. Every hour a truck spends idling represents a leakage in return on capital employed (ROCE), because the asset keeps accruing fixed costs even when it is not generating revenue. The reduction in logistics friction post-GST triggered a “cost of capital” release mechanism operating through three channels: (i) higher asset utilisation (the truck), (ii) working-capital release (the inventory), and (iii) CAPEX rationalisation in fleet composition and acquisition.
Saving Mechanism
A practical metric for valuing logistics delays is the cost of idleness. Research by IISD and industry inputs suggest that an idle truck incurs a loss of Rs. 1,000–Rs. 1,500 per day.14 This reflects fixed costs that continue regardless of movement: loan/lease EMIs, insurance, permits, and driver wages.
To use a single central estimate, take the median of the cited range:

If a truck is delayed for D days, the direct economic loss from idleness is:
L = D × Cd
So, in the pre-GST regime, if a truck spent 48 hours (2 days) waiting at high-friction borders (e.g., Walayar in Kerala or Dubudi in West Bengal), the economy effectively destroyed:
L = 2 × 1, 250 = Rs. 2, 500 per trip
When such delays are removed, this is capital that is no longer wasted and is effectively “returned” to the logistics ecosystem.
A lane-based illustration links time savings directly to trip economics. Let:
- Pre-GST TAT (Delhi–Chennai): ∼ 5 − 6 days
- Post-GST TAT (Delhi–Chennai): ∼ 3 − 4 days
- Time saved: ∆T = 2 days
Strip = 2 × 1, 250 = Rs. 2, 500 per trip
This operational saving allows fleet operators to increase the number of revenue-generating trips per month with the same asset base. The result is higher capital efficiency for the trucking fleet and a lower need for incremental CAPEX to move the same volume of goods.
Inventory Holding and Working Capital Release
Beyond transporter asset utilisation, the cargo owner (manufacturer/retailer) benefits through a reduction in inventory holding costs. Under the pre-GST tax structure, firms often built a “tax- compliant” warehousing model rather than a logistically efficient one. To avoid the Central Sales Tax (CST) on inter-state sales, companies set up small warehouses in multiple states and structured movement as stock transfers rather than sales.
GST, by subsuming CST and enabling Input Tax Credit (ITC) across state lines, supported consol- idation into fewer, larger, and more automated distribution centres (DCs) under a hub-and-spoke model.15,16
- Mechanism: Faster transit times reduce “In-Transit Inventory.” Improved supply chain reliability reduces the need for “Safety Stock” (buffer inventory kept to guard against delays).
- Quantitative Impact: This consolidation and speed led to a 30% reduction in inventory levels and a 40% increase in inventory turnover, as reported in NITI Aayog studies.17
- Cost of Capital Implication: For a large FMCG firm with Rs. 1,000 Crores in inventory, a 20-30% reduction releases Rs. 200-300 Crores of working capital. At a conservative corporate cost of capital of 10-12%, this yields an annual saving of Rs. 20-30 Crores directly attributable to logistics efficiency.18
CAPEX Rationalisation in the Trucking Sector
The reduction in logistics friction also reshaped the nature of capital deployed in road freight. In the post-GST environment, higher and more predictable utilisation made a shift toward higher- tonnage vehicles (HCVs) and containerised movement economically viable. As trucks spent less time idling at borders and checkpoints and more time in productive motion, the fixed costs of larger, more expensive assets could be spread over a greater number of revenue-earning kilometres.
Furthermore, recent policy moves to rationalise GST on commercial vehicles, reducing rates from 28% to 18% in specific contexts or ensuring smoother ITC flow, have reduced the acquisition cost of fleets. CRISIL’s assessment of rated fleet operators reflects this shift: revenues are projected to grow at 8-10%19 , supported by utilisation levels of 86-87%, while operating margins are expected to remain stable in the 8.0–8.5% range.20 These trends show that smoother corridors are converting efficiency gains into scalable growth, not higher costs. Higher utilisation and lower entry barriers reinforce a virtuous cycle, boosting investment, enabling modern fleets, and steadily lowering system-wide transport costs.
Logistics Costs and Inflation Transmission
A central hypothesis of the GST reform was that reduced logistics costs would serve as a structural disinflationary force. In an economy where logistics costs act as a markup on every physical good, efficiency gains should, in principle, transmit through supply chains and soften retail prices over time.
Historically, it was widely cited that India’s logistics costs hovered between 13% and 14% of GDP, a statistic that signalled severe inefficiency compared to global standards.21 However, a landmark 2024 report by the Department for Promotion of Industry and Internal Trade (DPIIT) and NCAER estimates India’s logistics cost at 7.97% of GDP (FY 2023-24).22
This re-baselining marks an important shift in how the sector’s performance is assessed. While part of the difference reflects improved measurement, the report explicitly links the gradual moderation in costs to structural reforms, most notably GST, the PM Gati Shakti National Master Plan, and investments in Dedicated Freight Corridors. The movement from a perceived 14% to 8% suggests that a substantial logistics-related “friction premium” embedded in Indian goods has already been eroded. These gains matter because logistics costs function as a system-wide markup on physical goods, and reductions can transmit through supply chains to influence retail prices. The transmission operates through two main channels:
- Direct Channel: Lower freight rates reduce the wholesale prices of commodities, partic- ularly for low-value, high-volume goods such as cement, steel, and agricultural produce, where freight is a significant cost component.
- Indirect Channel: Reduced working capital costs allow manufacturers to improve margins or absorb input cost spikes without raising retail prices.
RBI Bulletin analyses and SBI Research note that GST-led efficiency gains, combined with GST rate rationalisation in sectors such as FMCG and consumer durables, are expected to exert a gradual, positive influence on CPI inflation.23 While pass-through is incremental rather than immediate, the overall direction is clear: logistics reform has strengthened the structural link between efficiency gains and price stability.
Evidence from Trends
E-Way Bill Generation as a Proxy for Velocity
The volume of e-way bills generated provides a high-frequency proxy for freight velocity and economic activity. Post-pandemic data shows a sustained surge in e-way bill generation, with repeated record highs. For instance, in September 2025, e-way bill generation touched 132.1 million, a 21.8% year-on-year increase.24 This scale, alongside robust GST revenues, signals higher velocity of goods movement and deeper formalisation of logistics activity. It also reflects a structural break from the pre-GST regime: the system can now process large volumes through digital compliance rather than physical bottlenecks at checkpoints.
CRISFrex Index and Frontier Utilisation
CRISIL’s freight rate index (CRISFrex) highlights a strong correlation between freight rates and diesel prices. Despite structural efficiency gains from GST, through higher truck utilisation and reduced stoppages, freight rates remained sticky or rose during periods of elevated fuel costs.25,26 The implication is clear: Efficiency gains prevented a sharper rise in inflation rather than causing outright deflation. Without GST, the combination of high diesel prices and legacy border frictions would likely have produced double-digit supply-chain inflation. The efficiency dividend, therefore, functioned as a shock absorber, moderating the pass-through of global energy price pressures.
Operational data from logistics platforms reinforces this picture. Firms such as Rivigo demonstrated “frontier” performance through relay trucking, showing that trucks could cover 500+ km/day in pilot runs once border checks were removed. Similarly, BlackBuck reported meaningful reductions in idle time and improved route optimisation after the elimination of check-post delays.27,28 The gap between frontier efficiency (around 500 km/day) and the national average (around 325 km/day) indicates both progress and remaining headroom: regulatory barriers have eased, but a fragmented operator base is still adapting to the new operating reality, leaving significant room for future efficiency gains.
COVID-19 as a Stress Test: Resilience via Digital Backbone
The COVID-19 pandemic provided an unprecedented exogenous stress test for India’s post-GST logistics framework. Unlike reform transition shocks, which are endogenous and gradual, the pandemic imposed an abrupt and simultaneous disruption across production, transport, and labour markets. This makes it a useful comparative case for evaluating whether structural logistics reforms translated into real-world resilience. India’s experience can be read against the broader global breakdown in supply chains during 2020–22.
India vs. Global Supply Chain Inflation
Globally, the post-COVID recovery was defined by severe structural fragility. In the United States and Europe, inflation did not merely rise; it breached four-decade ceilings, with US consumer prices peaking at 9.1 percent29 in June 2022 and Eurozone inflation hitting 10.6 percent30 shortly thereafter. Crucially, this was not solely a monetary phenomenon. Research by the Federal Re- serve Bank of San Francisco indicates that supply-side factors, specifically logistics constraints and labour shortages, contributed roughly 60 percent to this inflationary surge.31
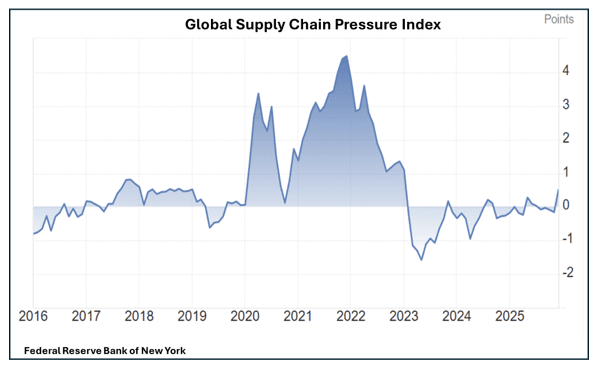
The Federal Reserve Bank of New York’s Global Supply Chain Pressure Index (GSCPI) quantifies disruption using a z-score, measuring stress in standard deviations from its historical mean. In December 2021, the index reached 4.4 standard deviations above average, an extreme reading. This signalled failure, not congestion: transport capacity, ports, and delivery schedules could not scale with rebounding demand, triggering a bullwhip effect (a cascading mismatch where small demand shocks amplify into large upstream disruptions).
Globally, the post-COVID recovery was defined by severe structural fragility. In the United States and Europe, inflation did not merely rise; it breached four-decade ceilings, with US consumer prices peaking at 9.1 percent29 in June 2022 and Eurozone inflation hitting 10.6 percent30 shortly thereafter. Crucially, this was not solely a monetary phenomenon. Research by the Federal Re- serve Bank of San Francisco indicates that supply-side factors, specifically logistics constraints and labour shortages, contributed roughly 60 percent to this inflationary surge.31
In contrast, while India was not insulated from supply shocks, its internal logistics backbone dis- played notable resilience.
Resilient Recovery: E-way bill data captures a distinct V-shaped recovery. From a lockdown nadir of 8.5 million in April 2020, volumes surged fivefold to 42.7 million by June 2020, recovering to pre-pandemic levels within eight weeks.32 By October 2020, generation breached historical records at 64 million, indicating rapid restoration of goods movement capacity despite ongoing restrictions in contact-intensive services, labour availability, and discretionary demand.33
Divergent Inflation Dynamics: Inflationary mechanics in India decoupled from the Western pat- tern. While US and Eurozone inflation was fed by logistical paralysis,34 the Reserve Bank of India (RBI) attributed domestic price pressures primarily to imported cost-push factors, specifi- cally crude oil and edible oils, along with global food and weather-related shocks, rather than a seizure of internal trade corridors.35 The core freight network remained operative; goods continued to move, preventing the localised scarcity premiums that drove Western supply chain inflation.
The Digital Buffer: This resilience was engineered, not accidental. The digital architecture of the GST Network (GSTN) allowed authorities to implement “green corridors” virtually. During the Delta wave crisis, this digital infrastructure complemented railway-run ‘green corridors’ for Oxygen Express trains, which delivered over 30,000 MT of Liquid Medical Oxygen (LMO) across India, with technical stoppages cut to about a minute for crew changes.36 Under the pre-2017 regime, such coordination would have faced the administrative friction of check-post inspections, where physical verification would have become a fatal bottleneck.
The “Buffer” Hypothesis
It is analytically sound to argue that GST-era logistics efficiency gains functioned as a buffer against global inflationary pressures. Counterfactual reasoning is instructive. Had India entered the pandemic under the pre-2017 regime marked by fragmented state levies, physical check-posts, and manual documentation, external supply shocks would likely have been magnified by administrative friction.37
Before GST, commercial vehicles routinely lost a significant share of transit time at inter-state borders for tax compliance. Overlaying pandemic health protocols on this legacy system would have caused severe delays, increased contagion risks, and localised supply disruptions. Physical stamping and in-person verification would have slowed freight movement precisely when speed and flexibility were most critical.
Instead, the contactless e-way bill system decoupled tax compliance from physical interception. While production was disrupted, the mechanism of movement remained largely intact, allowing goods flows to resume rapidly once restrictions eased.38 Disruptions occurred, but they did not harden into persistent supply constraints.
Efficiency gains prevented a sharper rise in inflation rather than causing outright deflation. By limiting purely logistical delays, the digital logistics backbone reduced scarcity premia and dampened inflation transmission. In this sense, GST evolved from a tax reform into a crisis-time macroeconomic stabiliser, strengthening the economy’s capacity to absorb extreme shocks.
Confounding Events and Stabilisation Effects
While multiple external and structural factors influenced logistics outcomes in the post-GST period, they do not negate efficiency gains. Instead, they complicate the clean identification of GST’s impact while remaining broadly consistent with the view that GST-era logistics reforms acted as a buffer, helping the system absorb large external shocks rather than fully transmit them into prices.
• Diesel Price Volatility
Fuel typically accounts for roughly 40–50 percent of a truck’s operating costs, so sustained diesel price increases after 2017 would normally be expected to feed directly into higher freight rates and broader inflation.39 Over 2017–2024, diesel prices rose sharply, driven by global crude cycles and domestic tax policy. In a counterfactual without logistics improvements, this shock alone would likely have pushed logistics costs and inflation higher than observed. Efficiency gains from GST-era reforms,40 shorter border delays, lower idle time, and higher daily kilometres per vehicle appear to have absorbed part of this cost shock, showing up less as outright price reductions and more as a prevention of an even sharper rise in logistics costs. In this sense, efficiency improvements and fuel prices moved in opposite directions, with the former partially offsetting the inflationary impulse of the latter.
• Infrastructure Upgrades
Observed gains in truck speed and reliability reflect the interaction of GST with a parallel wave of infrastructure investment. Highway expansion and corridor upgrades under programmes such as Bharatmala Pariyojana improved road quality and added capacity on key freight routes. On their own, however, better roads in the pre-GST regime were often undermined by check-post queues and paperwork at state borders. Post-2017, the removal of most inter-state trade barriers and the rollout of e-way bills enabled trucks to fully exploit improved corridors, converting higher speeds into more predictable, longer daily runs. The resulting increase in average daily truck movement is therefore best understood as a systems- level improvement, Better Roads + Fewer Barriers, rather than a single-policy effect. This joint upgrade raised the economy’s shock-absorption capacity by ensuring that disruptions in production or global prices did not automatically translate into crippling delays in domestic goods movement.
• Market Structure
India’s trucking sector remains highly fragmented, with a large share of vehicles owned by very small operators. This structure limits the extent to which advanced optimisation tools, such as dynamic routing, fleet-level scheduling, and integrated warehousing, can be adopted at scale. Even so, the shift to a digital, rules-based GST regime delivered baseline efficiency improvements for this fragmented majority: fewer compulsory stops, clearer documentation requirements, and more predictable transit times. While small operators could not fully mon- etise every efficiency gain, the aggregate effect of modest improvements across thousands of firms strengthened supply continuity. In periods of global disruption, this broad-based reduction in friction likely helped prevent cost pressures from escalating into widespread lo- gistics bottlenecks, reinforcing the view of GST-era logistics reforms as a stabilising, rather than purely cost-cutting, force.
Conclusion
The evidence presented in this study indicates that the introduction of the Goods and Services Tax (GST) marked a decisive structural break in India’s logistics system. Rather than functioning merely as a one-time cost-reduction reform, GST re-engineered the institutional foundations of goods movement by dismantling inter-state check-posts and replacing paper-based enforcement with a unified digital compliance framework. This shift raised average daily truck movement from roughly 225 km to about 300–325 km, reduced turnaround time variability, and eliminated a major source of idling and uncertainty that had long constrained asset utilisation.
These gains had important microeconomic consequences. Faster, more predictable transit freed working capital previously locked in transit inventory, enabled the consolidation of warehousing networks, and allowed firms to reorganise supply chains around efficiency rather than tax arbitrage. The scale of e-way bill adoption further entrenched these changes, ensuring that compliance no longer required routine physical interception and preserving the velocity gains achieved immediately after GST’s introduction.
The macroeconomic significance of these improvements lies primarily in stabilisation rather than dramatic, one-off disinflation. The post-2017 period coincided with sharp increases in diesel prices, fuel accounting for roughly 40–50 percent of trucking costs, driven by global crude cy- cles and domestic taxation. Freight rate indices closely tracked fuel prices, and logistics efficiency gains were therefore not fully reflected in lower freight rates or earlier headline CPI prints. In this context, GST’s contribution is best understood counterfactually: without faster movement, fewer stoppages, and higher utilisation, the same fuel shocks would likely have produced a much steeper rise in logistics costs and stronger inflationary pass-through, particularly during the pandemic and subsequent global disruptions. The recent easing of CPI inflation to levels below prevailing global inflation is consistent with this buffer role, suggesting that domestic supply-side frictions have not amplified imported price shocks as seen in several advanced economies.
The COVID-19 episode provides a revealing stress test. While global supply chains experienced systemic failure, manifesting in extreme readings of the Global Supply Chain Pressure Index and supply-driven inflation in advanced economies, India’s internal logistics network recovered rapidly after the initial lockdown shock. High-frequency indicators such as e-way bill volumes, rail freight movement, and emergency logistics operations show that the basic “plumbing” of goods movement remained functional. The digital decoupling of tax compliance from physical interception ensured that disruptions did not harden into persistent supply constraints or widespread scarcity premia.
At the firm level, frontier outcomes achieved by relay-trucking and platform-based operators demonstrate the latent potential of the post-GST regime. Pilot operations exceeded 500 km per day once border frictions were removed, yet the national average plateaued closer to 325 km per day, reflecting the dominance of small operators with limited access to technology, finance, and scale. This gap underscores that GST created the institutional conditions for large efficiency gains but did not automatically guarantee their full realisation.
Overall, the evidence supports a “buffer” hypothesis. GST-era logistics reforms did not prevent all disruptions, nor did they deliver immediate, across-the-board price reductions. They did, however, convert a previously fragile, checkpoint-ridden system into one capable of processing higher volumes at greater speed with less friction, precisely as the global environment became more volatile. In doing so, GST evolved from a tax reform into an element of macroeconomic stabilisation policy, quietly strengthening India’s capacity to absorb external shocks to fuel, food, and global shipping without allowing them to cascade into sustained domestic supply-chain inflation.
References
- https://www.niti.gov.in/sites/default/files/2021-06/ FreightReportNationalLevel.pdf
- https://www.iisd.org/sites/default/files/gsi/ffs_india_irade_ trucking.pdf
- https://medium.com/@shorealan201/the-great-indian-logistics-transformation-how-11-years- rewired-a-nations-arteries-67a00f4c6a5d
- https://morth.nic.in/sites/default/files/File2842.pdf
- https://economictimes.indiatimes.com/industry/transportation/long-haul-trucks-covering-greater- distance-post-gst-govt-study/articleshow/62126045.cms?from=mdr
- https://www.icra.in/Rating/DownloadResearchSpecialCommentReport/2601
- https://www.itln.in/one-year-of-gst-has-it-really-been-a-game-changer-for-the-road-logistics- sector
- https://content.knightfrank.com/research/677/documents/en/india-warehousing-and-logistics- india-warehousing-market-report-2018-5326.pdf;
- https://www.firstpost.com/tech/news-analysis/rivigo-a-tech-enabled-logistics-startup-bets-big-on- driver-relay-system-for-faster-delivery-3686479.html
- https://www.crisil.com/content/dam/crisil/our-analysis/reports/Research/archive/industry- research/2015/06/CRISIL-Opinion-GST-to-cut-logistics-costs.pdf
- https://economictimes.indiatimes.com/news/economy/policy/e-way-bill-integrated-with-fastag- rfid-gst-officers-to-get-real-time-data-of-commercial- vehicles/articleshow/82764820.cms?from=mdr
- https://www.adb.org/sites/default/files/publication/725796/sawp-082-technology-india-road- freight-transport.pdf
- https://www.thehindubusinessline.com/economy/e-way-bill-generation-surges-to-all-time-high- at-1055-crore-in-august/article68651863.ece
- https://www.iisd.org/sites/default/files/gsi/ffs india irade trucking.pdf
- https://content.knightfrank.com/research/677/documents/en/india-warehousing-and-logistics- india-warehousing-market-report-2018-5326.pdf
- https://www.logisticsinsider.in/gst-2-0-and-indias-logistics-sector-from-reform-to-resilience/
https://www.niti.gov.in/sites/default/files/2023-02/Freight report.pdf
- https://blog.locus.sh/5-changes-you-need-in-your-supply-chain-design-post-gst/
- https://www.crisilratings.com/en/home/newsroom/press-releases/2025/10/fleet-operators- revenues-to-rise-8-10-percent-on-continued-domestic-demand.html
- https://www.whalesbook.com/news/English/transportation/GST-Cut-on-Commercial-Vehicles-to-Lower-Acquisition-Costs-and-Boost-Operator-Growth/68ff32fa29ffae371d315119
- https://www.niti.gov.in/sites/default/files/2023-02/Freight report.pdf
- https://www.pib.gov.in/PressReleasePage.aspx?PRID=2195125®=3&lang=2
- https://www.livemint.com/economy/gst-reforms-impact-cpi-inflation-retail-inflation-could-fall- 35-bps-fy26-sbi-research-report-rupee-depreciation-economy-11765600062126.html
- https://www.newindianexpress.com/business/2025/Oct/23/road-freight-traffic-hits-record-high-in- first-half-of-fy26
- https://www.crisilratings.com/content/dam/crisilcom2-0/our-analysis/reports/crisil- intelligence/2025/01/crisfrex-a-review-of-the-indian-freight-industry.pdf
- https://dst.news/news/freight-rates-flat-in-line-with-diesel-utilisation-up-crisil/
- https://scroll.in/article/843278/as-gst-opens-up-indian-highways-a-former-mckinsey-consultant- is-ready-to-profit-by-the-truckload
- https://economictimes.indiatimes.com/small-biz/policy-trends/truck-aggregators-on-track-after- crossing-gst-hump/articleshow/59555472.cms?from=mdr
- https://www.bls.gov/opub/ted/2022/consumer-prices-up-9-1-percent-over-the-year-ended-june- 2022-largest-increase-in-40-years.htm
- https://ec.europa.eu/eurostat/documents/2995521/14698150/2-16092022-AP-EN.pdf
- https://www.frbsf.org/wp-content/uploads/sites/4/el2023-14.pdf
- https://taxguru.in/goods-and-service-tax/enhancement-downloading-e-way-bills-month- period.html
- https://carajput.com/blog/e-way-bill-generation/
- https://www.frbsf.org/research-and-insights/publications/economic-letter/2023/06/global-supply- chain-pressures-and-us-inflation/
- https://www.bis.org/publ/bppdf/bispap142 i.pdf
- https://www.newindianexpress.com/nation/2021/Jun/13/oxygen-express-trains-delivered-over- 30000-mt-of-liquid-oxygen-across-india-2315665.html
- https://panducollegeonline.co.in/attendence/classnotes/files/1764265348.pdf
- https://gstcouncil.gov.in/sites/default/files/2024-02/electronic-way-bill-050819.pdf
- https://masterdpiit.digifootprint.gov.in/static/uploads/2025/09/7d467e0f4aee2362e4bf90b84b7a5332.pdf
- https://gstcouncil.gov.in/sites/default/files/2024-02/electronic-way-bill-050819.pdf