

Executive Summary
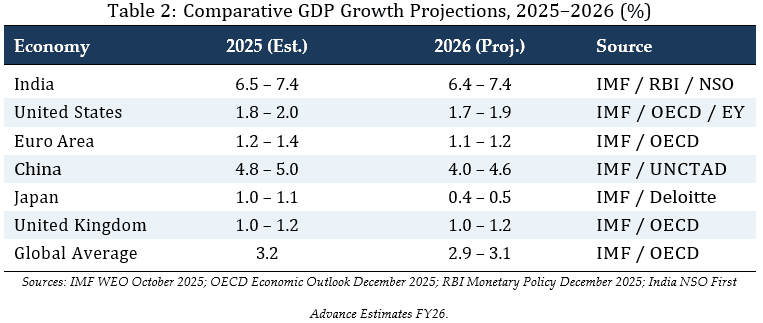
The world economy is losing altitude. The IMF projects global growth at just 3.1% for 2026; the OECD places it lower still, at 2.9%. The United States is slowing. Europe is stagnating. China is faltering under the weight of its property crisis. Japan is barely moving. The post-pandemic recovery is over, the era of easy money is over, and the structural headwinds of trade fragmentation, geopolitical tension, and demographic decline are beginning to bite.
And then there is India.
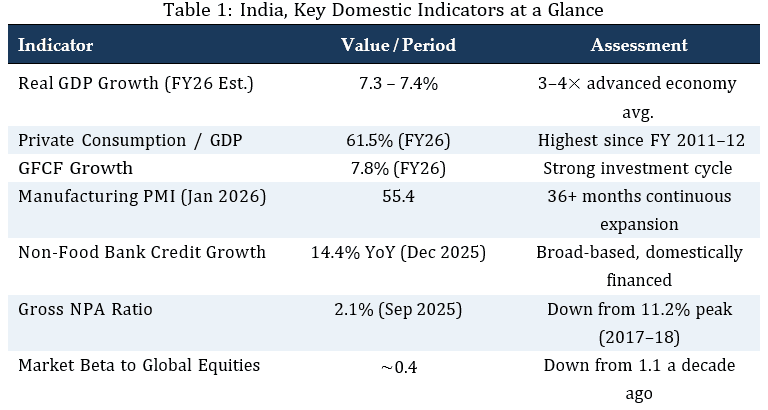
Growing at nearly 7%, with manufacturing in continuous expansion for over three years, with domestic consumption powering over 61% of GDP, its highest share in more than a decade, with foreign exchange reserves at an all-time high and external debt ratios falling, India is not merely outperforming the global economy. It is pulling away from it. The gap between India’s growth rate and the advanced-economy average is now roughly four to one. A decade ago, Indian equities moved nearly in lockstep with global markets; today, the beta has collapsed to 0.4. The correlation is breaking. The dependence is fading.
This report assembles evidence across seven distinct dimensions, from comparative GDP and PMI data to equity market beta, credit dynamics, and reserve adequacy, and asks a single question: is India experiencing a temporary phase of relative outperformance, or has something more fundamental changed in the structure of its economy?
The answer, supported by data from the IMF, RBI, S&P Global, Morgan Stanley, the World Bank, and India’s National Statistics Office, is that the shift is structural. India’s growth engine has become primarily domestic, its financial system increasingly self-sustaining, and its external position resilient enough to weather global turbulence without crisis. This is not decoupling in the absolute sense; no economy of 1.4 billion people is an island. But it is a measurable, documented, and accelerating reduction in India’s synchronisation with the global business cycle.
The implications are significant. For policymakers, India’s growth can be sustained through domestic reform even during global stagnation. For investors, it offers gen- uine diversification driven by a fundamentally different set of dynamics. For analysts, India should be benchmarked against its own structural potential, not a slowing world.
India is no longer a leveraged bet on the global cycle. It is becoming a standalone story, and the world is only beginning to notice.
1. Global Economic Context and Contrast
The global economy in early 2026 is defined by sluggish growth, persistent trade frag- mentation, and policy uncertainty. According to the International Monetary Fund’s October 2025 World Economic Outlook, global real GDP growth is projected at 3.2% for 2025 and 3.1% for 2026, a continued deceleration from the 3.3% recorded in 2024.[1] The OECD’s December 2025 Economic Outlook places the figure even lower, projecting global growth to slow to 2.9% in 2026.[2] The World Bank’s June 2025 Global Economic Prospects report noted that 2025 growth of 2.3% would mark the slowest expansion since 2008, excluding outright global recessions.[3]
Among the major economies, the picture is uniformly subdued. The United States is expected to grow at approximately 1.7% to 1.9% in 2026, weighed down by the lagged effects of tariff escalation and tightening fiscal conditions.[4] The Euro Area is projected at roughly 1.1% to 1.2%, with Germany continuing to stagnate and France hovering near 0.9%. Japan, despite a brief uptick in 2025, is expected to slow to approximately 0.4% to 0.5% in 2026 as weak exports and structural constraints reassert themselves.[5] China’s growth forecast has been downgraded to approximately 4.0% to 4.6% for 2026, reflecting continued property sector weakness, subdued consumption, and declining confidence in the private sector.[6]
Against this backdrop, India’s performance is not merely relatively strong; it is structurally divergent. The IMF projects India’s GDP growth at 6.4% for both calendar years 2025 and 2026.[7] The RBI has revised its FY 2025–26 estimate upward to 7.3%.[8] India’s National Statistics Office places FY 2025–26 real GDP growth at 7.4%.[9] This is not a small outperformance margin. India’s growth rate is approximately three to four times that of the advanced economy average (1.5%) and nearly double the global mean.
The core question this report addresses is whether this gap reflects a temporary phase of relative outperformance within the same global cycle, or whether it represents a more durable structural shift in India’s relationship to the global economy. The evidence, when examined across manufacturing, domestic demand, financial markets, and external indicators, points toward the latter.
2. Manufacturing Strength and PMI Evidence
The Purchasing Managers’ Index (PMI) is a diffusion index derived from monthly surveys of purchasing managers in the manufacturing sector. It is compiled by S&P Global and measures five components: new orders (weighted at 30%), output (25%), employment (20%), supplier delivery times (15%), and stock of purchases (10%). A reading above 50 indicates expansion, while a reading below 50 signals contraction. The PMI is widely regarded as a leading indicator of real economic activity because it captures forward-looking business decisions such as ordering, hiring, and inventory accumulation before they appear in official GDP data.[10]
The heatmap in Figure[11] visualises this divergence across 20 economies over almost two decades. India’s row stands out as an almost unbroken band of green (above 50), in sharp contrast to the persistent red and yellow stretches visible across the Eurozone, Japan, and several other developed and emerging peers.
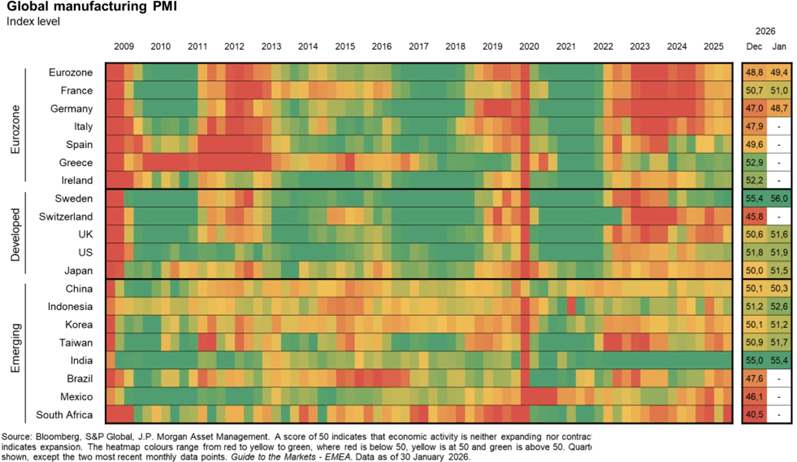
India’s manufacturing PMI has remained consistently above the 50-mark for over three years, a streak that is unmatched by any other major economy during the same period. In January 2026, the HSBC India Manufacturing PMI registered 55.4, up from a two-year low of 55.0 in December 2025. This rebound was driven by faster growth in new orders, production output, and employment.[13] The domestic demand environment remained the primary driver, with export orders increasing at a more modest pace.[14]
The contrast with global peers is stark. According to the J.P. Morgan Global Manufacturing PMI published by S&P Global in January 2026, the global manufacturing sector recorded only marginal growth, with several major economies in contraction. Ger- many, the eurozone’s industrial anchor, remained in contractionary territory. Japan saw new business decline. The United States registered below-trend manufacturing activity.[15]
S&P Global’s own analysis, published on 9 January 2026, confirmed that India recorded “by far the largest output gain” in the global manufacturing sector for 2025 as a whole.[16] This is significant because it demonstrates that India’s growth is not purely consumption- driven or services-led. The manufacturing sector is contributing meaningfully to aggregate output, supported by domestic demand, rising investment in technology, and the ongoing effects of the “Make in India” and production-linked incentive (PLI) pro- grammes. A sustained period of manufacturing expansion, running well above the global average, constitutes evidence of structural divergence, not cyclical coincidence.
3. Core Growth and Domestic Momentum Indicators
India’s GDP growth has not been concentrated in a single sector or a narrow segment of the economy. Real GDP grew 8.2% in Q2 FY 2025–26 (July to September 2025), accelerating from 7.8% in Q1 and 7.4% in Q4 of FY 2024–25. Real Gross Value Added (GVA), which strips out taxes and subsidies to measure pure sectoral output, expanded by 8.1% during the same quarter.[17] This broad-based expansion is critical to the de- coupling thesis, because growth that is diversified across sectors is structurally more resilient than growth driven by a single industry or export windfall.
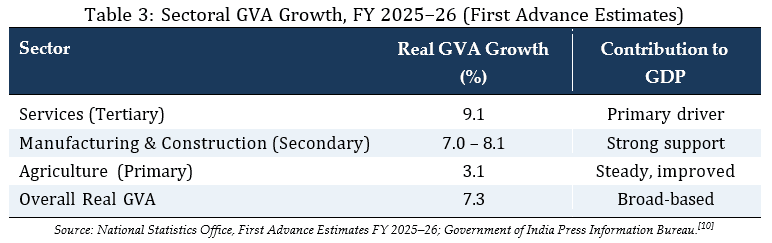
The services sector, expanding at 9.1%, remains the principal growth driver, but it is supported by strong manufacturing and construction output at 7.0%, and a recovery in agriculture at 3.1%. This is not the growth profile of an economy riding a single commodity boom or a speculative capital inflow. It is the profile of an economy with deep internal demand.
Crucially, private final consumption expenditure (PFCE) is projected to grow at 7.0% in FY 2025–26, accounting for 61.5% of GDP, the highest share since FY 2011–12. Gross fixed capital formation (GFCF), which captures investment in physical assets like factories, roads, and equipment, is growing at 7.8%.[10] High-frequency indicators confirm this momentum: digital payments via UPI are at record volumes, air and rail passenger traffic continue to climb, and e-way bill generation (a proxy for goods movement across states) remains elevated.[9] The implication is that India’s growth engine is primarily domestic. Unlike export- dependent economies such as Germany, South Korea, or Vietnam, India’s expansion does not hinge on the health of global demand. This internal orientation is a structural feature, not a policy accident, and it is the single most important factor behind India’s reduced synchronisation with the global cycle.
4. Financial and Market Indicators of Decoupling
4.1 Declining Market Beta
In equity markets, one of the most commonly used measures of co-movement is beta. Beta measures the sensitivity of a stock or a market index to movements in a broader benchmark. A beta of 1.0 means the asset moves in lockstep with the benchmark. A beta above 1.0 means it is more volatile than the benchmark, while a beta below 1.0 means it is less sensitive to the benchmark’s swings.
Morgan Stanley’s Chief Asia Equity Strategist Jonathan Garner, in a June 2025 analysis, noted that India’s market beta to global equities has fallen to approximately 0.4, down from 1.1 a decade ago. Garner attributed this to three structural factors: “First, India’s superior economic and earnings growth. Second, lower exposure to trade tariffs. And third, a strong domestic investor base.” Systematic Investment Plan (SIP) flows driven by a young urbanising population exceeded USD 3 billion per month in mid-2025, providing consistent capital inflows that underpin the equity market.[18]
Ridham Desai, Morgan Stanley’s Head of India Research and Chief India Equity Strategist, reinforced this thesis in January 2026, noting that India ended 2025 with “its weakest relative performance versus Emerging Markets since 1994,” partly because “India’s low beta in a global bull market” limited participation in an AI-driven rally. However, Desai argued that the tide is turning, with policymakers deploying aggressive reflation measures and India’s growth cycle “poised for a positive surprise.”[19] This structural reduction in beta, from 1.1 to 0.4 over a decade, is perhaps the single clearest quantitative indicator of financial decoupling. Earlier analysis from Morgan Stanley Research, published in June 2024, had projected that India’s stock market was setting up for “the longest bull run in its history,” supported by growing domestic investment in equities, improving social equity, and a fast-evolving tech sector, with the potential for 20% annual earnings growth over the subsequent five years.[20] These structural drivers, anchored in domestic fundamentals rather than global risk appetite, further support the partial decoupling thesis.
4.2 Domestic Credit Growth
On the credit side, the evidence is equally compelling. Non-food bank credit growth accelerated to 14.4% year-on-year in December 2025, up from 11.1% in December 2024. This growth was broad-based, led by personal loans (particularly vehicle loans), lending to micro, small, and medium enterprises (MSMEs), and industrial credit.[21] The banking sector itself is in structurally sound condition: gross non-performing assets (NPAs) have declined from a peak of 11.2% in 2017–18 to 2.1% as of September 2025, and profitability metrics like return on assets remain at multi-year highs.[22]
Credit rating agency CRISIL projected bank credit growth for FY 2025–26 at 12–13%, supported by GST rationalisation, RBI rate cuts, and the continued formalisation of the economy.[23] The combination of strong credit growth and a healthy banking sector means that India’s domestic investment cycle is being financed from within, not reliant on external capital market conditions or global interest rate cycles. This is a foundational element of structural decoupling.
5. External Resilience and Vulnerability Metrics
For an economy to credibly claim reduced dependence on the global cycle, it must demonstrate that its growth is not being financed by rising external vulnerability. If a country is growing fast but accumulating unsustainable external debt or running down its reserves, that growth is fragile, not decoupled. India’s external metrics tell a reassuring story.
5.1 Foreign Exchange Reserves
Foreign exchange reserves reached an all-time high of USD 723.8 billion in the week ending 30 January 2026, providing import cover of approximately 11 months, a level the RBI considers highly comfortable.[24] This buffer grew substantially through 2025, with reserves rising by approximately USD 53 billion during the calendar year, reversing the modest depletion seen in 2024. The reserve composition has also shifted strategically, with gold holdings increasing to USD 137.7 billion, reflecting the RBI’s diversification toward tangible safe-haven assets.[25]
5.2 Current Account and External Debt
India’s current account deficit (CAD) moderated to 0.8% of GDP in the first half of FY 2025–26, down from 1.3% in the corresponding period of the previous year.[10] The narrowing was supported by a widening services trade surplus (driven by computer services and business process outsourcing exports) and a sharp increase in inward remittances, which rose 10.7% year-on-year. India remains the world’s largest recipient of remittances, with inflows of USD 135.4 billion in FY 2024–25.[26]
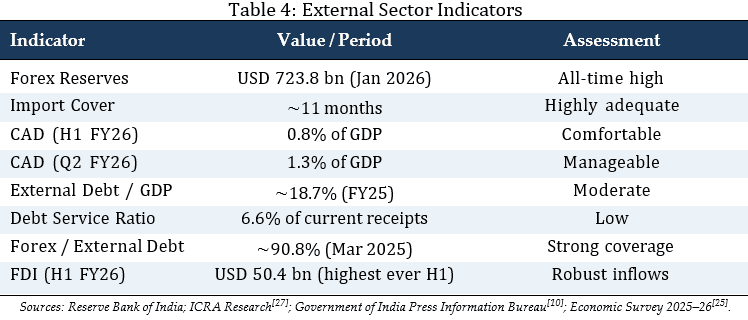
On the external debt front, India’s total external debt stood at USD 736.3 billion as of March 2025, with the debt service ratio at just 6.6% of current receipts, a level that is low by international standards. The share of short-term debt by residual maturity fell to a 10-year low of 41.2% of total external debt.[27] Meanwhile, gross FDI inflows in the first half of FY 2025–26 reached USD 50.4 billion, the highest ever recorded for any first half, indicating that long-term capital continues to flow into India based on structural fundamentals, not short-term carry trades.[28]
Taken together, these external metrics demonstrate that India is not financing its high growth through rising external fragility. The reserves are ample, the current account deficit is narrow, the debt ratios are manageable, and the quality of capital inflows is improving. This external resilience is what distinguishes genuine decoupling from a temporary growth spurt funded by borrowed money.
6. Synthesis and Interpretation
The evidence presented across this report converges on a single conclusion: India’s economic trajectory is becoming increasingly independent of the global business cycle. The channels of this independence are mutually reinforcing.
Domestically driven GDP growth, anchored in consumption and investment rather than exports, means that a slowdown in global demand does not mechanically translate into an Indian slowdown. Broad-based sectoral expansion in manufacturing, ser- vices, and construction reduces concentration risk. A declining market beta means that global financial volatility has a diminishing impact on Indian asset prices. Strong forex reserves and low external debt ratios mean that India is not vulnerable to sudden stops in capital flows. And a narrowing current account deficit means that the economy is not becoming more exposed to the global financial cycle even as it grows faster.
Deloitte’s January 2026 India economic outlook captured this dynamic precisely, noting that “entering 2026, the Indian economy remains resilient, with sustained growth momentum and domestic demand, despite global uncertainties and trade disruptions.”[29] Morgan Stanley Investment Management, in its January 2025 analysis, similarly described India as “a much more domestically oriented growth story, especially given low goods exports to the U.S., lower oil prices and capital controls that should keep household savings flowing to domestic assets.”[30]
6.1 Addressing Counterarguments
The counterarguments deserve serious engagement.
Capital flow dependence. The most common objection is that India remains dependent on global capital flows, particularly foreign portfolio investment (FPI), and that a severe global risk-off event would still hurt Indian markets and the rupee. This is true, and this report does not argue otherwise. In late 2025, FPI outflows did put pressure on the rupee, which depreciated to record levels against the dollar. However, the structural point is that the domestic investor base, particularly through mutual fund SIPs, has grown large enough to absorb significant FPI selling without triggering a systemic event. Garner noted that “this domestic bid on stocks is unlikely to fade anytime soon,” providing “a strong foundation for the market.”[17] The RBI’s reserve position provides an additional stabiliser.
Trade insulation as default, not decoupling. A second objection is that India’s relatively low trade-to-GDP ratio (merchandise exports account for roughly 12–14% of GDP) simply insulates it from trade shocks by default. There is merit in this observation. However, the decoupling thesis rests on more than trade insulation. It rests on the quality and breadth of domestic demand, the health of the financial sector, the accumulation of reserves, and the declining correlation of Indian financial assets with global benchmarks. These are not passive features of a closed economy. They are the result of active structural reforms, including the goods and services tax (GST), the Insolvency and Bankruptcy Code (IBC), the formalisation of banking through digital infrastructure, and sustained public capital expenditure.
Energy import vulnerability. A third objection notes that global oil prices and energy imports remain a vulnerability, and a severe oil shock could widen the current account deficit rapidly. This is a legitimate risk. However, crude oil prices averaged USD 60– 65 per barrel in late 2025, well below the levels that would trigger external stress.[31] The argument here is not that India is risk-free, but that its structural position has improved enough to sustain high growth even when the global environment is weak.
7. Conclusion
What distinguishes this report’s findings from the familiar narrative of “India is growing fast” is the reinforcing nature of the evidence across dimensions that do not normally move together.
Consider how the pieces interlock. The banking system’s transformation, from an NPA crisis that threatened to choke credit supply to a position of structural health, did not merely improve one ratio. It unlocked the domestic credit channel that now finances the investment cycle at 14% annual growth, independent of global interest rate conditions. That credit expansion feeds the manufacturing sector whose PMI streak is unmatched globally, which generates employment and income that sustains the consumption share of GDP at levels unseen in over a decade. Meanwhile, the accumulation of foreign exchange reserves alongside a narrowing current account deficit means this entire domestic flywheel is not being powered by borrowed external capital. Each element validates the others. Remove one, and the thesis weakens. But none of them are weakening. They are all strengthening simultaneously.
This convergence is what separates structural decoupling from cyclical luck. An economy can outperform the world for a year or two on the back of a commodity wind- fall, a credit binge, or a favourable base effect. It cannot sustain that outperformance across manufacturing, services, consumption, investment, credit quality, reserve adequacy, and capital market behaviour simultaneously unless something fundamental has changed in its underlying architecture.
India is not immune to the world. A severe oil shock would pressure the current account. A global financial crisis would test even the deepest domestic investor base. No serious analyst would claim otherwise. But the economy that faces those risks in 2026 is a different economy from the one that faced them a decade ago. The buffers are larger, the internal engine is stronger, and the transmission channels from global weakness to domestic slowdown have narrowed, a market beta collapsing from 1.1 to 0.4 in a single decade is not a subtle shift, it is a structural break in how India relates to the global cycle.
The analytical shift this demands is significant. India can no longer be modelled as a high-beta emerging market that amplifies global trends. It is a distinct macro story, one whose trajectory is shaped more by its own reform momentum, its own consumption dynamics, and its own capital formation cycle than by the direction of the S&P 500, the Fed funds rate, or the health of Chinese property developers. The divergence documented across six sections of this report is not a forecast awaiting confirmation. It is an observable reality. And it is accelerating.
References
- International Monetary Fund. (2025, October 14). World Economic Outlook, October 2025: Global economy in flux, prospects remain dim. IMF. https://www.imf.org/en/publications/weo/issues/202 5/10/14/world-economic-outlook-october-2025
- Organisation for Economic Co-operation and Development. (2025, December). OECD Economic Outlook: Global economy proves resilient but remains fragile. OECD. https://www.oecd.org/en/about/ne ws/press-releases/2025/12/global-economy-proves-resilient-but-remains-fragile.html
- World Bank. (2025, June). Global Economic Prospects, June 2025. World Bank Group. https://thed ocs.worldbank.org/en/doc/8bf0b62ec6bcb886d97295ad930059e9-0050012025/original/GEP-June-2025.pdf
- EY. (2025, December 15). 2026 global economic outlook: Growth slows amid supply disruptions. Ernst & Young. https://www.ey.com/en_us/insights/strategy/global-economic-outlook
- Deloitte. (2026, January). Global economic outlook 2026. Deloitte Insights. https://www.deloitte.com/us/en/insights/topics/economy/global-economic-outlook-2026.html
- United Nations Conference on Trade and Development. (2025, December 3). Global growth expected to slow to 2.6% through 2026. UNCTAD. https://unctad.org/news/global-growth-expected-slo w-26-through-2026
- International Monetary Fund. (2026). India and the IMF: Country data. IMF. https://www.imf.org/en/countries/ind
- Press Information Bureau, Government of India. (2025, December). 2025: A defining year for India’s growth. PIB. https://www.pib.gov.in/PressNoteDetails.aspx?NoteId=156770&ModuleId=3®= 3&lang=1
- Press Information Bureau, Government of India. (2026, February 1). India’s real GDP estimated to grow by 7.4% in FY 2025–26, with nominal GDP growth at 8%. PIB. https://www.pib.gov.in/PressReleasePage.aspxPRID=2221389®=3&lang=1
- Trading Economics. (2026). India Manufacturing PMI. Trading Economics. https://tradingeconomics.com/india/manufacturing-pmi
- J.P. Morgan Asset Management. (2026, January 30). Global manufacturing PMI [Heatmap]. Guide to the Markets – EMEA. Bloomberg, S&P Global. https://am.jpmorgan.com/lu/en/asset-managemen t/per/insights/market-insights/guide-to-the-markets/guide-to-the-markets-slides-europ e/global-economy/gtm-ce-pmimanufacturing/
- J.P. Morgan Asset Management. (2026, January 30). Global manufacturing PMI [Heatmap]. Guide to the Markets – EMEA. Bloomberg, S&P Global. https://am.jpmorgan.com/lu/en/asset-managemen t/per/insights/market-insights/guide-to-the-markets/guide-to-the-markets-slides-europ e/global-economy/gtm-ce-pmimanufacturing/
- Business Standard. (2026, February 2). India manufacturing PMI rebounds in Jan to 55.4 as orders, output pick up. Business Standard. https://www.business-standard.com/economy/news/manufactu ring-pmi-january-2026-expansion-economy-production-126020200206_1.html
- Fibre2Fashion. (2026, February 2). India’s manufacturing growth strengthens as index rises in January. Fibre2Fashion News. https://www.fibre2fashion.com/news/textile-news/india-s-manuf acturing-growth-strengthens-as-index-rises-in-january-308140-newsdetails.htm
- S&P Global. (2026, January 2). J.P. Morgan Global Manufacturing PMI®, December 2025 [Press re- lease]. S&P Global Market Intelligence. https://www.pmi.spglobal.com/Public/Home/PressReleas e/f52d63602f2c4e1b8f9c1e5a597c3429
- S&P Global Market Intelligence. (2026, January 9). Global manufacturing PMI data hint at shifting global growth trajectories in 2026. S&P Global. https://www.spglobal.com/marketintelligence/en/mi/research-analysis/global-manufacturing-pmi-data-hint-at-shifting-growth-jan26.html
- Press Information Bureau, Government of India. (2025, December). 8.2% GDP: India’s growth story strengthens. PIB. https://www.pib.gov.in/PressReleasePage.aspx?PRID=2195990®=3&lang=1
- Garner, J. (2025, June 24). India outperforms with high growth and low volatility [Podcast tran- script]. Thoughts on the Market, Morgan Stanley. https://www.morganstanley.com/insights/podcast s/thoughts-on-the-market/indian-stock-market-outlook-jonathan-garner
- Desai, R. (2026, January 14). The case for India’s market comeback [Podcast transcript]. Thoughts on the Market, Morgan Stanley. https://www.morganstanley.com/insights/podcasts/thoughts-o n-the-market/india-market-momentum-2026-ridham-desai
- Desai, R. (2024, June 10). What could keep India’s bull market going? Morgan Stanley Ideas. https://www.morganstanley.com/ideas/india-election-stock-outlook
- Mohan, R. (2026, February 6). Non-food credit growth accelerates to 14.4% Y-o-Y in Dec 2025: RBI data. Business Standard. https://www.business-standard.com/finance/news/non-food-credit-g rowth-accelerates-to-14-4-y-o-y-in-dec-2025-rbi-data-126020601250_1.html
- Insights on India. (2026, January 9). Indian banking sector turnaround: RBI Financial Stability Report 2025. Insights on India. https://www.insightsonindia.com/2026/01/09/upsc-editorial-a nalysis-indian-banking-sector/
- CRISIL Ratings. (2025, April 15). Bank credit seen growing 100–200 bps on-year to 12–13% this fiscal. CRISIL. https://www.crisilratings.com/en/home/newsroom/press-releases/2025/04/ba nk-credit-seen-growing-100-200-bps-on-year-to-12-13percent-this-fiscal.html
- DD News. (2026, January 30). India’s forex reserves cross USD 700 billion, RBI reports third straight weekly rise. DD News. https://ddnews.gov.in/en/indias-forex-reserves-cross-u sd-700-billion-rbi-reports-third-straight-weekly-rise/
- Whalesbook. (2026, February 6). India forex reserves hit record; Gold drives safe-haven shift. Whalesbook News. https://www.whalesbook.com/news/English/economy/India-Forex-Reserves-H it-Record-Gold-Drives-Safe-Haven-Shift/69861da6e769d12df1da353e
- Free Press Journal. (2026, January 30). India’s forex reserves hit all-time high of $709.413 billion ahead of Budget 2026. Free Press Journal. https://www.freepressjournal.in/business/indias-for ex-reserves-hit-all-time-high-of-709413-billion-ahead-of-budget-2026
- ICRA Limited. (2025, June). India’s external debt, June 2025. ICRA Research. https://www.icra.i n/Rating/DownloadResearchSpecialCommentReport?id=6414
- DD News. (2025, December). India’s forex reserves rise by $1.69 billion to $688.94 billion: RBI. DD News. https://ddnews.gov.in/en/indias-forex-reserves-rise-by-1-69-billion-to-688-94-billion-rbi/
- Deloitte. (2026, January). India economic outlook, January 2026. Deloitte Insights. https://www.de loitte.com/us/en/insights/topics/economy/asia-pacific/india-economic-outlook.html
- Morgan Stanley Investment Management. (2025, January). The BEAT: January 2025. Morgan Stan- ley. https://www.morganstanley.com/im/publication/insights/articles/article_thebeatjan2 025.pdf
- DD News. (2025, December). India’s GDP to grow 7% in FY26, CRISIL raises growth forecast. DD News. https://ddnews.gov.in/en/indias-gdp-to-grow-7-in-fy26-crisil-raises-growth-for ecast/