
Introduction
Several opinion makers have commented that India’s corporate landscape is increasingly dominated by monopolies. They have drawn historical parallels to colonial-era control by entities like the East India Company. These statements have fueled a perception that India’s economy is monopolistic compared to competitive markets like the United States, where regulatory frameworks are often more robust. This report evaluates this notion by examining market concentration in India and the USA, using data-driven analysis to determine whether India’s industries are more monopolistic. Our findings challenge this narrative, revealing that India’s markets are more competitive in most sectors than the rhetoric suggests, with the USA serving as a helpful benchmark for comparison.
Methodology
To assess the claim of monopolistic domination in India compared to the USA, we employed two quantitative approaches:
1. Sector-Wise Herfindahl-Hirschman Index (HHI) Analysis
- Source: We gathered data from the largest listed companies in India and the USA, using the BSE 500 and S&P 500 indices, respectively. These indices cover diverse sectors such as technology, healthcare, finance, and consumer staples.
- Procedure:
- Companies were grouped by sector (e.g., Financials, Technology).
- For each sector, we calculated each company’s market share as a percentage of the sector’s total market capitalization.
- We squared each company’s market share and summed these squares to compute the Herfindahl-Hirschman Index (HHI), a standard measure of market concentration.
- HHI Interpretation:
- Below 1500: Competitive
- 1500–2500: Moderately Monopolistic
- Above 2500: Highly Monopolistic
- Example Calculation: In a sector with three companies holding 50%, 30%, and 20% market share, the HHI would be (50²) + (30²) + (20²) = 2500 + 900 + 400 = 3800 (highly monopolistic).
2. Market Capitalization Concentration Curve
- Procedure:
- Companies within each index were ranked from largest to smallest by market capitalization.
- We calculated the cumulative market capitalization as a percentage of the total market cap for the index.
- Each company’s position was expressed as a percentage of the total number of companies (e.g., the 10th company in 500 = 2%).
- A Lorenz curve was plotted, with the x-axis showing the cumulative percentage of companies and the y-axis showing the cumulative percentage of total market capitalization.
- Interpretation:
- A steep curve indicates high concentration, where a few companies dominate the market cap.
- A more diagonal line suggests a more even distribution of market cap.
Analysis
HHI Results
The HHI analysis provides a sector-by-sector comparison of market concentration in India and the USA:
| Sector | BSE 500 (India) | S&P 500 (USA) |
| Consumer Discretionary | HHI: 908.70 Examples: Tata Motors, Maruti Suzuki, Titan Company, etc. | HHI: 1145.15 Examples: Amazon, Tesla, McDonald’s, etc. |
| Consumer Staples | HHI: 853.69 Examples: Hindustan Unilever, ITC, Nestle India, etc. | HHI: 1381.79 Examples: Walmart, Coca-Cola, PepsiCo, etc. |
| Financials | HHI: 1084.03 Examples: HDFC Bank, ICICI Bank, State Bank of India, etc. | HHI: 536.58 Examples: JPMorgan Chase, Bank of America, Berkshire Hathaway, etc. |
| Healthcare | HHI: 497.47 Examples: Sun Pharmaceuticals, Cipla, Dr. Reddy’s, etc. | HHI: 620.49 Examples: Johnson & Johnson, Pfizer, UnitedHealth, etc. |
| Industrials | HHI: 782.77 Examples: Larsen & Toubro, Bharat Electronics, InterGlobe Aviation, etc. | HHI: 283.75 Examples: Boeing, Caterpillar, FedEx, etc. |
| Materials | HHI: 528.64 Examples: Tata Steel, Hindalco Industries, Asian Paints, etc. | HHI: 681.65 Examples: Dow Inc., Freeport-McMoRan, Sherwin-Williams, etc. |
| Technology | HHI: 1294.53 Examples: TCS, Infosys, HCL Technologies, etc. | HHI: 681.72 Examples: Apple, Microsoft, NVIDIA, etc. |
| Average HHI | 849.98 | 761.59 |
The average HHI for India and the USA is well below 1500, indicating competitive markets in both nations. While India shows a slightly higher concentration in sectors like Financials and Technology, the USA has a greater concentration in Consumer Discretionary and Consumer Staples. However, neither country consistently dominates in terms of concentration across all sectors, and no industry in either nation reaches the 2500 mark for being “highly monopolistic” or even falls within the 1500-2500 range, challenging the notion that monopolies dominate India’s industries.
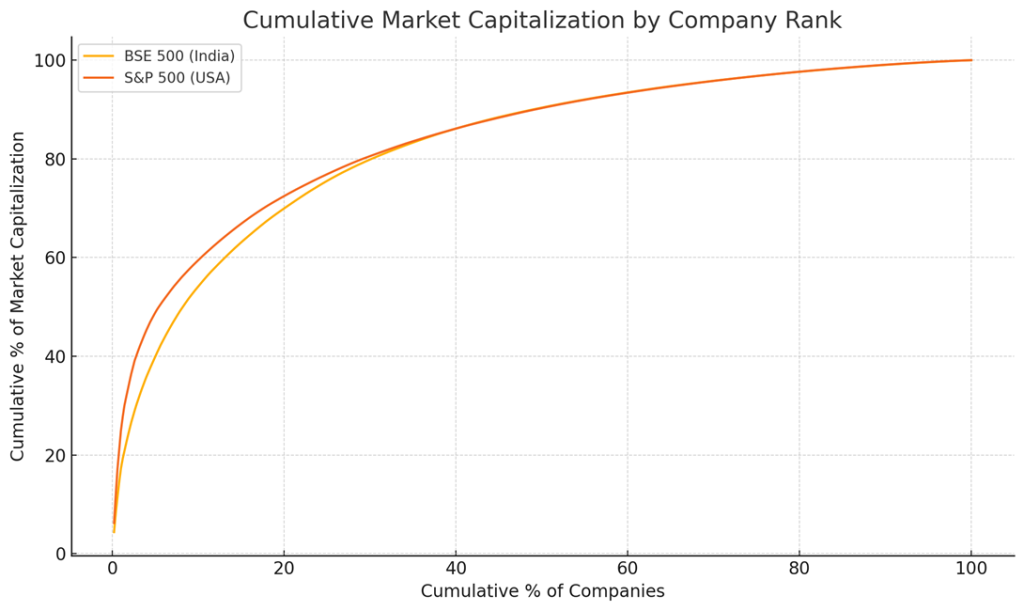
Market Capitalization Concentration Curve
The Lorenz curve analysis reveals how market capitalization is distributed across companies in each index. The curve for the USA rises more steeply at the beginning compared to India, indicating that the largest U.S. companies control a larger share of the total market cap than India’s largest firms. This suggests that contrary to the narrative, the USA exhibits greater concentration among its top companies than India.
Conclusion
This analysis disproves the narrative propagated by several commentators that India’s corporate landscape is predominantly monopolistic, particularly when compared to a competitive economy like the United States. The Herfindahl-Hirschman Index (HHI) results demonstrate that both India and the USA maintain highly competitive markets, with averages well below the 1500 threshold indicative of competitive markets. Notably, no sector in either country exceeds the 2500 threshold, which would signify a highly monopolistic structure, underscoring that India’s industries are far from being dominated by monopolies.
Furthermore, as illustrated in the graph, the market capitalization concentration curve reveals a critical insight: the largest U.S. companies command a disproportionately larger share of market capitalization compared to India’s leading firms. This finding directly contradicts the assumption that India suffers from greater corporate concentration. Instead, it highlights that the USA exhibits more pronounced market dominance by its top firms.
Collectively, these data-driven insights dismantle the misconception that India’s economy is uniquely monopolistic. Our findings affirm that India’s markets are competitive in most sectors and concentration among top companies is in line with large economies like the U.S. Policymakers and public figures must prioritize factual evidence to avoid perpetuating misleading impressions of India’s economic landscape.