Executive Summary
In 2011, the Trinamool Congress came to power promising Ma, Mati, Manush, and a new dawn after decades of stagnation. Fifteen years later, the structural weaknesses in the economy remain unresolved and in several respects have deepened. While the Government has expanded an extensive architecture of welfare programmes, the underlying economic fundamentals reveal persistent weaknesses in investment, industrial growth and fiscal sustainability. The result is a model where redistributive spending has grown even as the productive base of the economy has struggled to keep pace.
West Bengal’s fiscal position has deteriorated significantly over this period. Public debt has risen sharply, increasing nearly fourfold over the past fifteen years, while interest payments now absorb a substantial share of the state’s revenue receipts. At the same time, the composition of expenditure has increasingly tilted toward welfare commitments.
Budgetary allocations to sectors such as minority affairs and madrasa education have risen by over one thousand percent, far outpacing spending on wealth-generating sectors including heavy industry, micro-enterprises and information technology. This pattern raises important questions about the long-term sustainability of the state’s fiscal and developmental priorities.
Broader economic indicators reinforce these concerns. West Bengal’s share in national GDP has continued to decline, per capita income remains below the national average, and thousands of companies have shifted their base of operations to other states.
Structural constraints in the investment environment, including informal rent-seeking networks that function as implicit costs on investment and a labour climate marked by persistent political intervention, have weakened the state’s attractiveness as an industrial destination. Infrastructure gaps and rising industrial closures have further compounded these pressures.
As employment opportunities within the state have narrowed, outward labour migration has expanded significantly. Large numbers of workers from West Bengal now seek employment elsewhere in India, making the state a major source of migrant labour. This migration reflects a growing mismatch between the state’s labour supply and the availability of productive employment within its own economy and serves as a telling indicator of the opportunity deficit created by prolonged structural stagnation.
Rather than undertaking deep structural reforms to revitalise industrial growth and capital formation, the prevailing policy approach has largely relied on the expansion of welfare programmes and periodic surges in pre-election spending. Such measures address immediate distributional pressures but do little to resolve the deeper structural weaknesses that constrain long-term growth.
The outcome is insidious. The state is settling into a low-growth, high-debt equilibrium where fiscal stress compounds quietly, opportunity narrows steadily, and an entire generation is left to seek elsewhere what their home state has struggled to provide. This report examines how Bengal arrived at this point and what the evidence demands we confront.
Chapter 1: Introduction – The Broken Promise of Bengal
| The paper is a data-driven economic audit of West Bengal’s long-term structural decline from being one of India’s leading industrial and intellectual powerhouses to a state marked by stagnation, rising debt, and unemployment. It examines how successive regimes, from prolonged Left rule to the Trinamool Congress (TMC) Government, have shaped the state’s economic trajectory of decline through policy choices, fiscal mismanagement, and misplaced governance priorities. Drawing on official data sources such as RBI, MOSPI, NFHS, PLFS and State Budget documents, the paper evaluates macroeconomic performance, industrial strategy, labour trends, and fiscal sustainability across successive political phases. The objective is not merely to document decline, but to identify structural fault lines and assess whether current policy frameworks can deliver durable economic revival. |
I. Objective
Once celebrated as India’s intellectual capital and industrial nerve centre, West Bengal stood at the forefront of economic dynamism in the decades following Independence. From jute mills and engineering hubs to a thriving port economy anchored around Kolkata, the state was among the leading contributors to India’s Gross Domestic Product in the 1950s and 1960s. It symbolised enterprise, cultural confidence, and strategic economic weight in eastern India.
Yet, over the past six decades, that promise has steadily eroded. Bengal’s share in national GDP has declined sharply. Per capita income has slipped relative to the national average. Industrial stagnation, capital flight, mounting public debt and persistent unemployment now define much of the economic narrative. Successive political regimes, first under prolonged Left Front rule (1977-2011) and later under the Trinamool Congress (2011-present) have shaped this trajectory in different ways, but the structural outcomes raise serious questions about governance, policy priorities and fiscal sustainability. Over the past several decades, this promise has been systematically eroded by policy missteps, political priorities favoring short-term populism over long-term growth and a failure to adapt to India’s evolving economic landscape. Today, West Bengal grapples with chronic underperformance: stagnant industries, mounting debt, high unemployment and widespread out-migration.
This document presents a critical assessment of the structural failures that have plagued the state under successive political regimes, particularly the prolonged Left Front rule and the subsequent Trinamool Congress (TMC) regime. It examines whether Bengal’s decline was inevitable, policy-induced or politically entrenched. The aim is to move beyond rhetoric and present a data-driven economic audit of the state’s structural transformation or lack thereof.
II. Scope and Structure
This document is structured in ten analytical sections followed by two concluding assessments:
- A historical overview tracing Bengal’s transition from industrial dominance to decline.
- Structural evaluation of the Left Front era and its long-term economic imprint.
- Examination of the Trinamool Congress period: continuity versus reform.
- Analysis of four core macroeconomic indicators under the current regime.
- Industrial exodus and comparative investment performance.
- Labour migration patterns as a socio-economic barometer.
- Infrastructure bottlenecks and public capital formation gaps.
- Crisis in tea gardens and the plantation economy.
- Fiscal priorities, including welfare expenditure and budgetary allocations.
- Concluding evaluation of policy direction and the case for structural reset.
Together, these sections aim to present a systematic economic diagnosis of West Bengal’s trajectory and outline why a structural recalibration centred on industrial revival, fiscal discipline, infrastructure modernisation and employment-led growth is essential for restoring Bengal’s lost promise. Through this framework, this report seeks not only to diagnose the state’s economic woes but also to highlight actionable pathways for renewal and long term economic recovery, urging a departure from the cycles of decline that have betrayed the state’s immense potential.
To understand how West Bengal arrived at its current economic predicament, it is necessary to examine the deeper historical roots of its decline. The next chapter traces Bengal’s journey from being one of India’s foremost industrial centres to gradually losing its economic prominence over the decades.
Chapter 2: Historical Overview – The Long & Structural Decline of an Industrial Nerve Centre
| West Bengal’s economic trajectory reflects a long arc of structural decline from post-Independence industrial powerhouse to relative underperformance within India’s federal economy. Once contributing nearly 10% to national GDP and leading in manufacturing, the state’s share has fallen to nearly half that level, with per capita income slipping below the national average. A combination of Partition shocks, adverse policies such as freight equalisation, labour militancy, land fragmentation, and governance failures across successive regimes weakened its industrial base. The prolonged Left rule entrenched deindustrialisation, while the post-2011 period has seen nominal expansion without meaningful relative convergence. Bengal’s decline was cumulative and structural, shaped by historical, political and policy interactions over seven decades. |
Economically, West Bengal remained vibrant into the early 1960s, but policy headwinds and demographic pressures set the stage for reversal. The “Bengal Curve” captures this poignantly: 1960 rank 3 richest but by 2024, rank 24. [1]
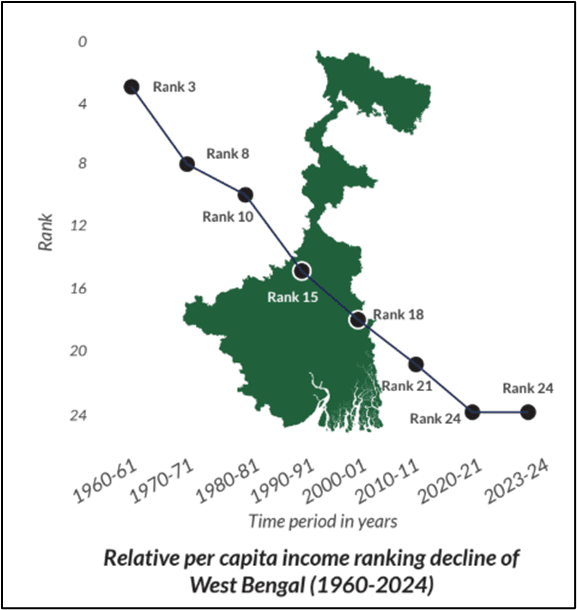
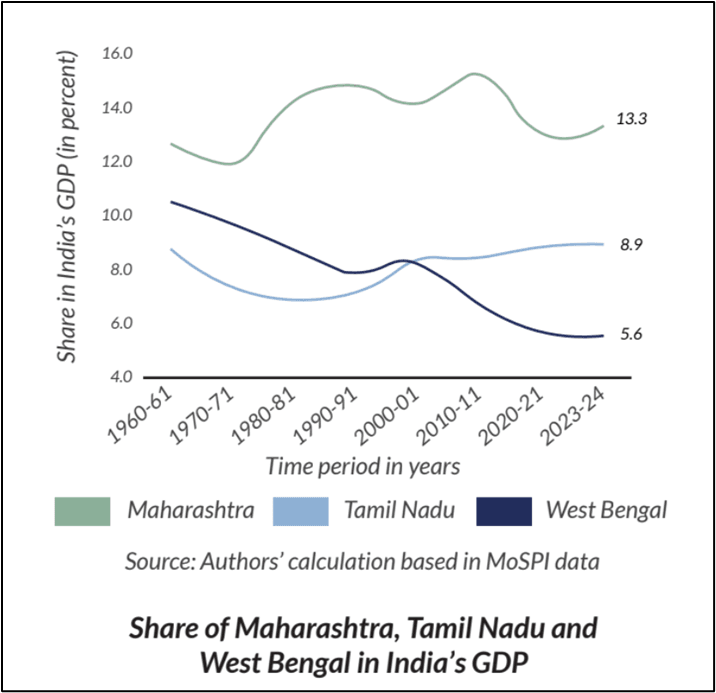
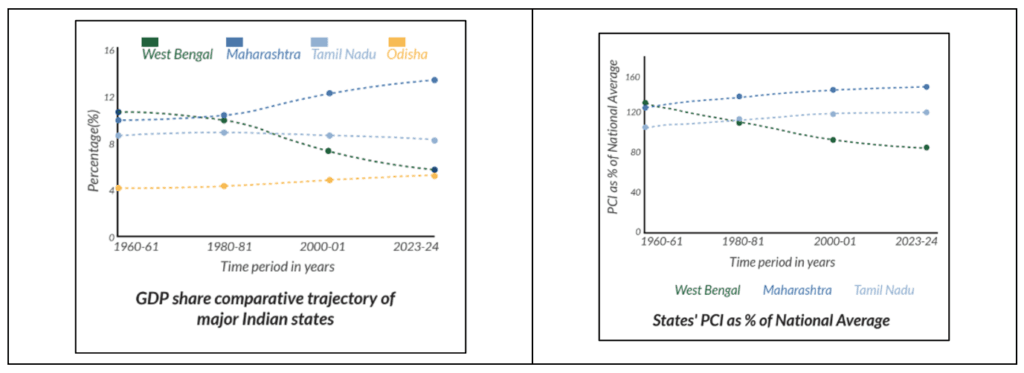
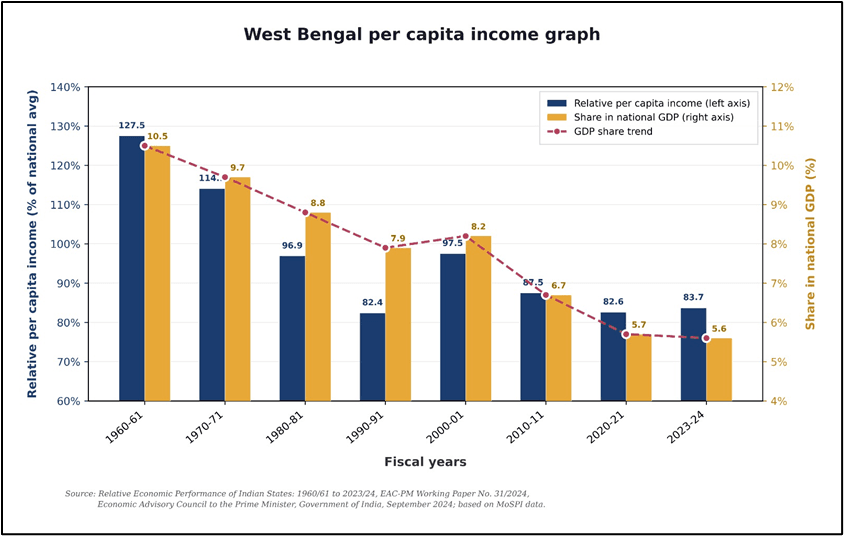
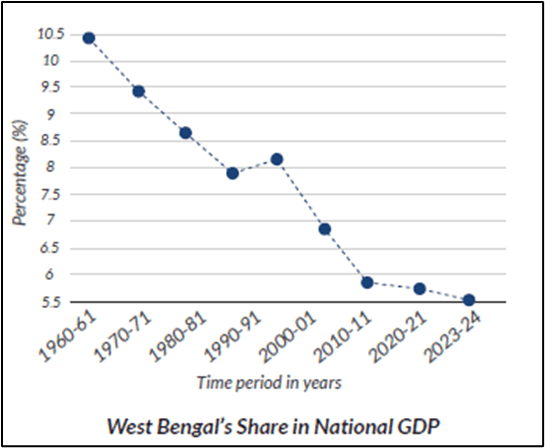
West Bengal’s post-Independence economic journey represents one of modern India’s most important cases of regional economic divergence. Once synonymous with industrial might and home to bustling jute mills along the Hooghly, engineering giants supplying national railways and Kolkata as the undisputed commercial capital of the East, the state has witnessed a steady erosion of its relative standing. According to the Economic Advisory Council to the Prime Minister’s (EAC-PM) comprehensive working paper Relative Economic Performance of Indian States: 1960-61 to 2023-24 by Sanjeev Sanyal and Aakanksha Arora, West Bengal’s share of national GDP declined from 10.5% in 1960-61 (third-highest among states) to just 5.6% in 2023-24 which is the sharpest drop recorded for any major state. Its relative per capita income fell from 127.5% of the national average (ranking among the top three) to 83.7% by 2023-24, placing it below states which were once far behind West Bengal, including Odisha. [2][3]
A research paper titled ‘The Political Economy of Decline of Industry’ in West Bengal by Subhash C. Ray meticulously documents statistical trends while critiquing governance failures across regimes. Together, these reveal recurring motifs: fiscal tensions, the long shadow of Partition and famines, labour militancy, land fragmentation and shifting policy priorities from industrialisation to populism. Far from a simple narrative of a single party ideological failure, the story illustrates how structural, political and historical forces interacted across Congress, Left Front (1977-2011) and Trinamool Congress (TMC 2011-present) administrations. The result is a state that struggles with large-scale manufacturing revival and capital retention. [4]
I. Bengal’s pre-1960s industrial dominance
- At Independence, West Bengal inherited a formidable industrial base forged under British rule. Kolkata served as the second city of the Empire, with the Hooghly industrial belt hosting world-class jute processing, engineering workshops, and port facilities.
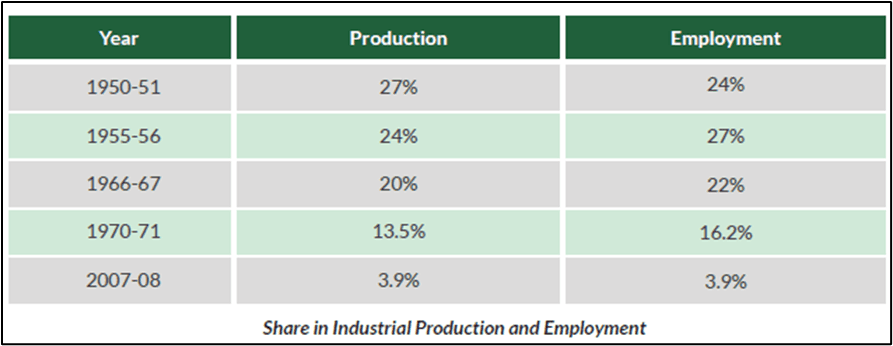
- In 1950-51, coastal provinces dominated national output: undivided Bombay (including future Gujarat) at 33%, West Bengal at 27%, and Madras at 12%. Central Statistical Organization’s Statistical Abstract India 1952-53 and the Census of Manufacturing Industries (1951), records West Bengal with 1,493 registered factories, the highest in the country surpassing the combined total of Maharashtra and Gujarat. Organized sector employment and production shares stood at 27% and 24% respectively by 1955-56.[5]
- Pre-Partition Bengal was the economic heart of eastern India, with jute as the premier cash crop and Calcutta the financial hub. The 1951-52 state elections cemented Congress rule under Bidhan Chandra Roy, who enjoyed cross-party respect.
- Congress secured 150 of 238 seats, while the Left (CPI-led bloc) took 41 and emerged as the main opposition, with Jyoti Basu as Leader of the Opposition.[6]
- However, beneath this apparent stability, structural pressures were already beginning to reshape Bengal’s economic prospects. Partition had disrupted supply chains, separated jute cultivation from many mills and triggered a massive refugee influx into the state. Addressing these challenges required sustained fiscal support and policy attention from the Union government. It was in this context that several early central policy decisions became contentious within Bengal’s political leadership.
- The first assault, courtesy Indian National Congress: Prime Minister Jawaharlal Nehru slashed West Bengal’s jute export duty share and reduced its income-tax divisible pool from 20% to 12%, while boosting Bombay’s to 21% and Madras’s to 18%.
- Refugee rehabilitation grants were deemed ‘insignificant’ compared to West Pakistan allocations. Bidhan Chandra Roy, a personal physician to Gandhi and Nehru, objected repeatedly but in vain. These policies, Ranajit Roy later argued in The Agony of West Bengal (1971), deliberately repositioned eastern India as a labour reservoir rather than an industrial core.[7]
By the late 1950s, West Bengal still led in factory numbers and output but national Five-Year Plans began tilting resources westward. The state’s per capita income, once the highest, started slipping. Partition’s refugee influx of millions straining tiny land parcels exacerbated fragmentation. Famine memories fostered a deep aversion to ‘commercial agents’ and large holdings.
II. Freight equalisation policy and structural setbacks
- West Bengal, historically one of India’s earliest industrial centres with a strong engineering, coal and jute base, saw its locational advantage decline under this regime. Prior to the policy’s implementation, the state and its hinterland formed part of India’s core industrial belt: combined with Bihar (present-day Jharkhand), the region accounted for a dominant share of steel and engineering production. However, across the three and a half decades from the mid-1950s to 1990s, industrial investment increasingly flowed towards states where raw materials could be brought at equalised freight rates but with better market access, infrastructure and logistics.
- The freight equalisation policy, introduced in 1952 and fully operational by 1956 as part of the Second Five-Year Plan, aimed at ‘balanced regional development’ by subsidising transport of key raw materials coal, iron ore, steel, cement so that prices were uniform nationwide. In theory, this encouraged factories in backward areas. In practice, it severely weakened the locational advantage of eastern mineral-rich states, thereby devastating their economies.
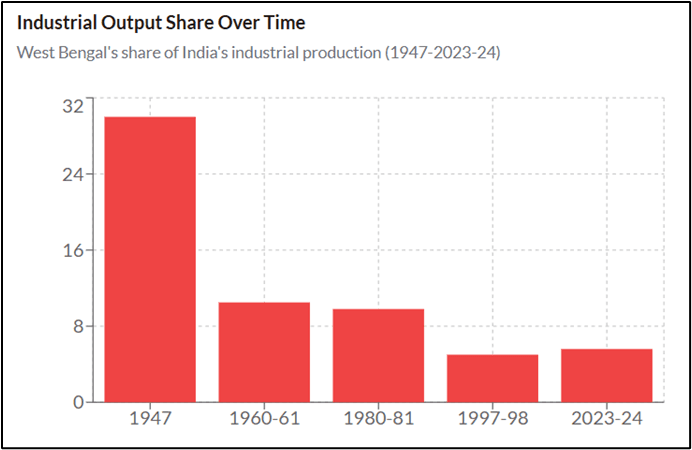
- Pre-policy, railways charged ₹30 per tonne-km for steel from Jamshedpur to Howrah versus ₹120 to Bombay. Equalisation averaged costs (e.g., ₹75 each), stripping Bengal of its proximity advantage. Coal tariffs followed identical logic, penalising Bihar and Bengal producers. Licensing policies further discriminated against advanced regions to promote equity. The combined effect was swift deindustrialization. West Bengal’s industrial output share dropped from ~27% in1947 to 17.2% by 1960-61 and the per capita income fell from first to eighth by 1966.[9]
- EAC-PM data confirms the long-term trajectory: Bengal’s GDP share slid steadily through the 1960s-80s. Eastern states became raw material suppliers rather than processors, a ‘resource curse’ dynamic. Odisha later reversed this through proactive reforms (mining, steel, ports), while West Bengal’s industrial base of jute engineering stagnated. It is noted how the policy exacerbated inequality, with western states compounding wealth via industrialisation and technology.[10]
III. Impact of prolonged Left rule (1977-2011)
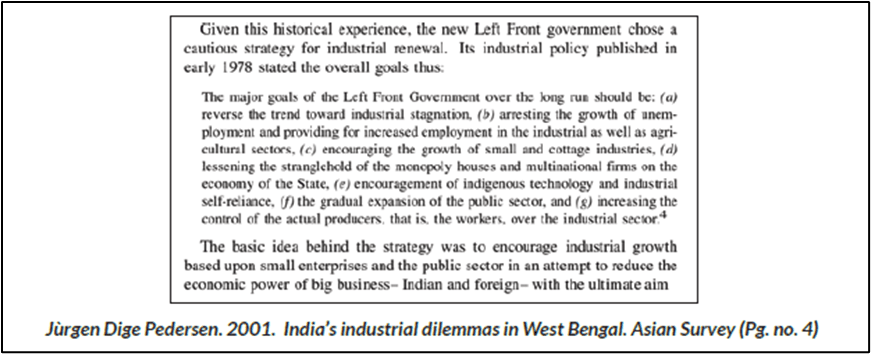
- The Left Front’s 34-year rule began in 1977 amid Emergency backlash, with CPI(M) securing 178 seats. Jyoti Basu served as the Chief Minister for most of the period (till 2000), followed by Buddhadeb Bhattacharjee (2000 – 2011). The 1978 Industrial Policy prioritised small and cottage industries, curtailed multinational entry and sought to break ‘monopoly capital.’ Four-point demands to the Centre like more licences, public investment, development funds and regulatory relaxation yielded little, perpetuating ‘step-motherly’ complaints from the Government of West Bengal.[11] Both the Centre and State Governments let Bengal down. The combined effect was to leave Bengal without the policy support required for industrial recovery.
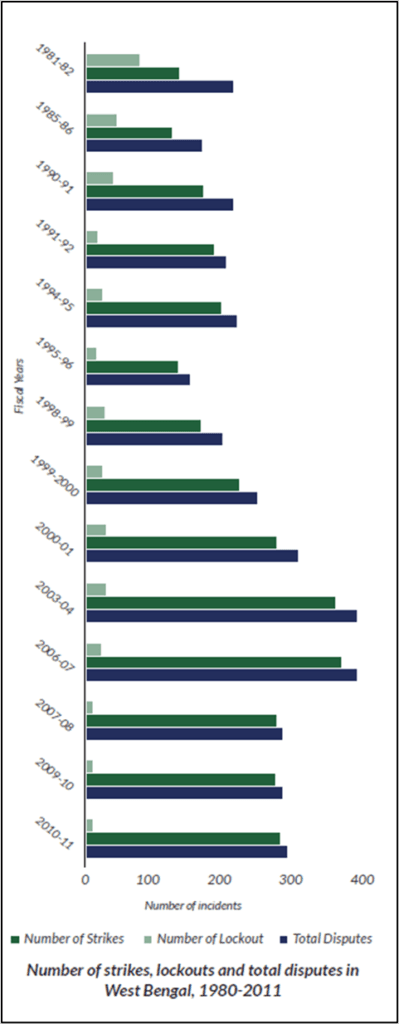
- Labour militancy defined the era. There were 179 strikes and 49 lockouts in 1965, which ballooned to 678 strikes and 128 lockouts in 1970 under United Front governments. Gherao workers physically encircling managers became iconic, endorsed by Labour ministers and risking personal safety. Ajoy Mukherjee, first non-Congress CM (1967), resigned citing Communist attacks on small industries, job losses (60-70 thousand) and farm produce seizures. Under the Left Front, lockouts rose massively (130 in 1980 and 400+ by 2003). Man-days lost in 2003 amounted to 1.6 million from strikes, 25.6 million from lockouts. By 2001-06, 152 strikes versus 2,266 lockouts. Contract labour proliferated and permanent workers fell to 30-40% in many units. Unions shifted from management confrontation to inter-union rivalry. [12][13]
- The proliferation of strikes, lockouts and gherao tactics under the Communist Party of India (Marxist)-led Left Front created a deeply hostile environment for industry in West Bengal. Militant trade unionism, often encouraged or politically protected by Left leadership, normalised the intimidation of management and frequent disruptions to production. Practices like Gherao turned labour disputes into coercive confrontations, severely undermining workplace stability. Investors increasingly viewed the state as unpredictable and unsafe for capital deployment, prompting businesses to relocate to more stable regions. This politicised labour culture eroded investor confidence, accelerated capital flight and steadily weakened Bengal’s once-vibrant industrial ecosystem.[14]
- West Bengal’s share in industrial production fell from 13.5% in 1970-71 to 5.1% in 1997-98 and 3.9% in 2007-08. The jute and engineering industries withered. Capital flight accelerated due to ‘lawlessness and militant trade unionism.’ Congress and the Left both encouraged small holdings via reforms, making land acquisition ‘impossible without acrimony’. These policies had unintended long-term economic consequences, particularly by making industrial land acquisition highly contentious.
- Ray concludes the core issue was ‘poor work culture, political interference, and failure of governance’ creating anarchy that deterred investors. All parties contributed to the CPM via unions, TMC via bandhs but the scale under the Left rule entrenched the decline. EAC-PM data shows the state’s GDP share dipping to ~6.7% by 2010-11. The era ended with massive anti-incumbency in 2011, but its industrial legacy, closed factories, extinguished chimneys still remains a critical and everlasting issue.[15]
IV. The to-be transition phase post-2011
- The period following 2011 represents a decisive phase in West Bengal’s economic trajectory, marked by repeated political commitments to industrial revival, and lip service to accelerated growth. These commitments were articulated prominently during electoral cycles and policy announcements. However, an examination of official data, comparative state performance and realised outcomes reveals a widening divergence between policy promises and economic delivery, contributing to a continuation, and in some indicators, an intensification, of the state’s long-term relative decline.
- Official publications of the Government of West Bengal emphasise nominal expansion in Gross State Domestic Product (GSDP) and revenue mobilisation. The West Bengal Economic Review 2024-25 reports that nominal GSDP rose to approximately ₹18-20 lakh crore by 2024-25, alongside increases in own-tax revenue and capital expenditure. While these figures indicate scale expansion, they offer limited insight into relative economic performance, which is more relevant for assessing structural improvement.
- However, even after adjusting for population expansion, the growth in overall GSDP has significantly outpaced the rise in GSDP per capita, revealing that economic expansion has not translated into proportional income gain for individuals. This divergence suppresses consumption demand and weakens long-term tax buoyancy for the state.
- Comparative data from the Economic Advisory Council to the Prime Minister[17] highlights structural weaknesses in the state’s economy. Its long-run analysis shows that West Bengal’s share in India’s GDP continued to stagnate during the post-2011 period, remaining near 5.5-6% in 2023-2024, far below its historical levels which is basically half as other states and far behind faster-growing peer states. More importantly, West Bengal’s per capita income has remained consistently below the national average, while states such as Tamil Nadu, Karnataka, Telangana and even Odisha recorded sustained convergence towards the national average or overtaking the metric during the same period. This divergence suggests that nominal growth has not translated into relative income gains or productivity improvement.
- Investment outcomes further illustrate the gap between intent and execution. Data released by the Department for Promotion of Industry and Internal Trade[18] show that during 2023-24 and 2024-25, West Bengal ranked among the top states in investment intentions (Industrial Entrepreneur Memoranda filings), yet fell sharply, outside the top ten, in actual investment realisation. In absolute terms, realised investments were less than one-tenth of announced proposals. This persistent shortfall indicates structural impediments in land acquisition, regulatory certainty, project execution, and investor confidence, despite repeated policy assurances of an improved business climate.
- Corporate mobility data reinforce this assessment. Official parliamentary disclosures by the Ministry of Corporate Affairs indicate that between 2011 and 2025, over 6,600 companies relocated their registered offices out of West Bengal[19] While the state simultaneously recorded an increase in new firm registrations, the sustained outward migration of existing firms, typically more capital-intensive and employment-generating, points to net erosion of the established industrial base rather than renewal. This trend stands in contrast to states such as Telangana and Gujarat, which experienced net inward firm movement over the same period.
- Growth comparisons published by Business Standard[20], based on official state accounts, further underscore relative underperformance. In 2024-25, West Bengal’s nominal NSDP growth rate of under 10% lagged behind Bihar, Uttar Pradesh, Odisha, Maharashtra, and Tamil Nadu. Repeated years of below-median growth imply a cumulative loss of economic weight, even when absolute output rises. In growth arithmetic, persistent underperformance compounds, widening inter-state gaps over time.[21][22]
- Taken together, the post-2011 transition phase is characterised less by economic turnaround than by missed convergence. Official data confirm that while fiscal aggregates and nominal GSDP expanded, West Bengal failed to translate political stability and repeated reform assurances into comparative growth, sustained investment inflows, or industrial deepening. In empirical terms, the period reflects a continuation of long-run decline: the economy grew, but not fast enough, not deeply enough, and not where it mattered most. This distinction between growth claims and relative outcomes is central to understanding the state’s present economic position.
While structural challenges and policy shifts in the early decades after Independence weakened Bengal’s economic foundations, the trajectory of decline became far more pronounced during the prolonged period of Left Front rule beginning in 1977. The following chapter examines how governance choices and labour politics during this era shaped the state’s economic structure.
Chapter 3: The CPI(M)-led Left Front Era: Structural Economic Stagnation
| The 34-year CPI(M)-led Left Front rule in West Bengal (1977–2011), a period of structural economic stagnation, is marked by industrial decline and fiscal stress. While the regime rose on the back of militant labour mobilisation and agrarian reform promises, politicised trade unionism, capital flight, and chronic lockouts eroded investor confidence and hollowed out the manufacturing base. The state’s share in national industrial production and GDP steadily declined, infrastructure rankings slipped, and public debt surged to unsustainable levels. Initial gains from land reforms proved short-lived, with agricultural growth slowing and yield stagnation setting in by the late 1980s. Overall, the chapter argues that ideological rigidity and adversarial industrial relations produced long-term economic underperformance. |
When Jyoti Basu led the CPI(M)-dominated Left Front to a landslide victory in the June 1977 state assembly elections, it inaugurated what would become a thirty-four-year experiment in parliamentary communism. The party had risen to prominence through decades of militant trade union organisation and agrarian struggle in the state. It promised to reverse the trajectory of deindustrialisation and working-class issues. Yet by 2011, when the Communist Party of India (Marxist) was voted out, West Bengal’s share of national GDP had collapsed from 10.5% in 1960-61 to just 6.7% in 2011-12[23], while its relative per-capita income had fallen from 27.5% above the national average to 14% below it during the same period.[24]
I. Politicisation of labour and trade union militancy
- The first general strike by Bengal Jute Workers’ Union was orchestrated in the late 1920s in response to the shift to single-shift operations and the extension of working hours from 54 to 60 hours per week. By the time of independence, a section of Bengal’s working class had developed a sedimented culture of political unionism.[26] This disruptive culture was the raw material from which the CPI and its successor the CPI(M) constructed their political project.
- The structural conditions that made West Bengal’s working class politically explosive also made it economically vulnerable. Employment in the organised industrial sector began to stagnate from the mid-1960s, and with it, the economic security of the workers whose militancy the communist parties were mobilising. Strikes in West Bengal factories rose from 179 in 1965 to 678 in 1970; lockouts increased from 49 to 128.[27]
- The United Front (UF) governments of 1967 and 1969, in which the CPI(M) was the dominant political force, represent the moment at which the party’s relationship to trade union militancy became openly parasitic.
- The product of this political strategy was Gherao, which was the physical encirclement and detention of factory management within factory premises, sometimes for hours or days.
- CPI(M)-affiliated CITU terrorised industrial capital, demonstrating the party’s coercive reach. And it generated the political crisis that, the CPI(M) calculated, would eventually produce conditions for its definitive seizure of power. But the costs of this strategy were borne, as always, by the very workers it purported to champion.
- The gherao put not only an individual’s property but also his personal freedom at risk, prompting factory owners to worry about the security of their investment in the state.[28] Capital began leaving West Bengal in the late 1960s, a flight that accelerated throughout the 1970s and that would devastate the organised working class for decades.
- In 1977 itself, there were 206 strikes and 191 lockouts. By 1980, strikes had fallen to 78 while lockouts stood at 130. By 1991, strikes had collapsed to 21 while lockouts had risen to 192.[29]
- In 1991, West Bengal recorded 192 lockouts. Man-days lost to lockouts averaged approximately 20 million annually in the early 1990s. For context, West Bengal contained approximately 7% of India’s industrial workers but accounted for over 40% of national lockout-related man-days lost in that period. In 1996, West Bengal ranked second nationally and 4 times ahead of the national average in lockout frequency with 80 official lockouts, while the median for other major states was fewer than 20.[31]
- The pattern of industrial relations that emerged under the Left Front’s management of CITU represents a corruption of the collective bargaining function. In a multi-union environment where CITU (CPI[M]), AITUC (CPI), INTUC (Congress), and other federations competed for recognition, each union’s militant posturing was directed primarily against rival unions rather than against employers.
- This pattern meant that workers in industries where CITU established monopoly control often found themselves in a worse negotiating position than in competitive union environments. Having eliminated rival unions that might have maintained genuine bargaining pressure, CITU settled into an accommodation with management that prioritised the stability of the political relationship over the material interests of workers.
- The progressive casualisation of the workforce was the direct product of this system. The West Bengal Statistical Handbook data shows that the share of informal employment among non-agricultural workers rose from 69% in 1999–2000 to 75% in 2004–05 overall, and from 71% to 78% in rural areas, and in urban areas from 68% to 72%.[32]
- In the 1980s, as computerisation and automation were transforming manufacturing productivity globally, CITU formally opposed the introduction of computers in factory operations, framing modernisation as a threat to employment.[33]
II. Capital flight and investor distrust
- Secretariat for Industrial Assistance (SIA) data for the period August 1991 to January 2003 show that West Bengal attracted only 3.85% of proposed private sector investment in India during these twelve years. Of this already-meagre proposed investment, only 35.4% was actually implemented, compared to a national implementation rate of approximately 55%.[36]
- In 2008, of 68,35,000 man-days lost throughout India due to politically-motivated closures unrelated to formal industrial disputes, West Bengal alone accounted for 58,54,000, a breathtaking 85.6% of the national total, from a state representing 7.6% of the national population.[38]
- Under the CPI(M), the general strike had become so routine as a tool of political expression that it was effectively factored into the cost of doing business. Investors who cared about production scheduling, supply chain reliability, and return on capital simply stopped investing in West Bengal. They went to states where their factories could operate.
- The compound effect of three decades of capital flight on state finances was catastrophic. As industrial activity shrank, so did the state’s own tax revenues, forcing the Left Front government to borrow increasingly to maintain social expenditure commitments, particularly the vast patronage apparatus that sustained its electoral machine. By 2010–11, West Bengal’s debt-to-revenue receipt ratio stood at 396.47%, one of the worst among all major Indian states.[39]
- Infrastructure quality is among the most decisive determinants of industrial investment location. Using a composite index of road density, railway connectivity, electricity generation capacity, and telecommunications density per capita, the state ranked 8th among major Indian states in 1970–71. By 1980–81, three years into Left Front rule, it had fallen to 9th. By 1990–91, thirteen years into CPI(M) governance, it ranked last among major states.[40]
III. Collapse of the manufacturing base
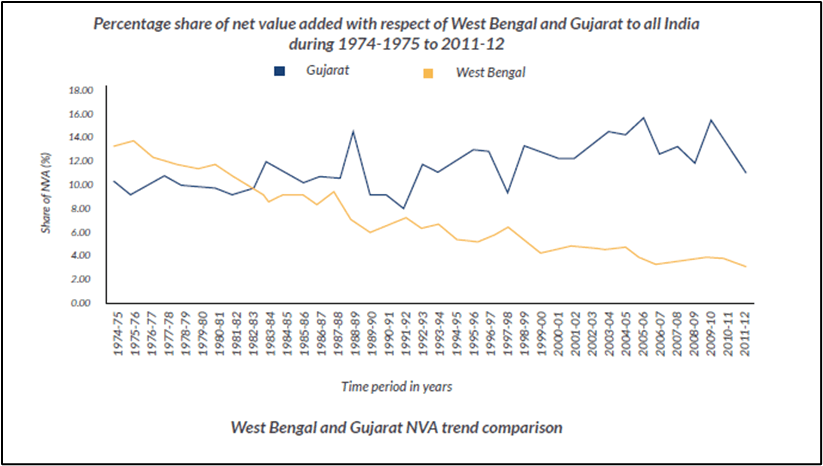
- In 1977–78, the year the Left Front came to power, West Bengal was ranked second only to Maharashtra in industrial employment and value-added among Indian states. By 1987-88, a single decade into CPI(M) rule, it had fallen to fourth in employment and fifth in value-added. By 2007–08, it ranked seventh. Over the same period, Gujarat rose from 9.7% to 16.1% of national industrial production, and Maharashtra maintained 18-19%.[41]
- Between 1977 and 2011, the number of registered factories in West Bengal grew from approximately 8,900 to 14,600, a growth rate of 64% over 34 years. In Gujarat, over the same period, the number of registered factories grew from approximately 11,500 to 27,000, a growth of 135%. Tamil Nadu went from 8,400 to 28,000 factories, a growth of 233%.[44]
- Production costs per ₹1,000 of gross output stood at ₹883 in West Bengal in 1994–95, against ₹818 in Gujarat, and ₹820 in Maharashtra. Every commodity produced in West Bengal costs more than in competing states, which was a structural competitive disadvantage that compounded over decades.[45]
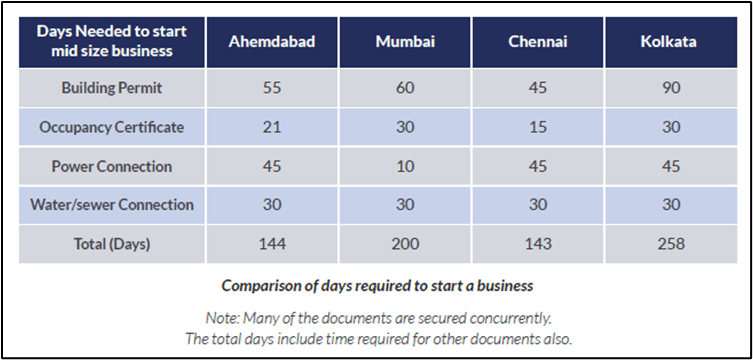
- In 2011, the days required to start a mid-size business were starkly high in Kolkata when compared with other Indian cities.[46]
IV. Agricultural stagnation and land politics
- The Left Front’s agrarian program rested on three pillars: land redistribution through the vesting and distribution of ceiling-surplus land, tenancy registration under Operation Barga, and democratic decentralisation through revitalised panchayati raj institutions.
- By the early 2000s, the incidence of landlessness had actually increased relative to the late 1970s: 41.6% of rural households were landless in 2006, and only 4.9% of holdings reported share tenancy, suggesting a substantial decline in formal tenancy arrangements. A growing trend of ‘reverse tenancy’ in which marginal farmers lease out their small plots to larger operators was also taking hold.[48]
- The agricultural momentum generated by the land reforms proved remarkably short-lived. Using time-series techniques that allow for endogenous structural breaks, Kundu found that the acceleration in aman rice yield growth from 1980–81 was followed by a significant decline from 1986–87, leading to a subsequent fall in the food grain production growth rate from 1987–88. This structural break antedated the liberalisation of the national economy in 1991, suggesting that the causes of stagnation were at least partly endogenous to the reform architecture itself.[49]
- The stagnation was most pronounced at the level of individual crop yields. The cultivation of the same crop on the same land over extended periods, combined with non-optimal doses of chemical fertiliser, caused soil fertility to decline. Yield stagnation of most important crops in the 1990s including aus, aman, and boro rice, and major cash crops became a primary cause of concern for the state’s food security.[50]
By the late 2000s, the economic and political consequences of prolonged stagnation had generated widespread dissatisfaction with the Left Front government. This environment paved the way for the rise of the Trinamool Congress in 2011, which promised a decisive break from the past. The next chapter evaluates how instead of arresting the communist-era decline, 15 years of TMC rule further exacerbated Bengal’s economic woes.
Chapter 4: The TMC Years (2011-Present): Continuity or Course Correction?
| West Bengal’s debt has nearly quadrupled to over ₹7.7 lakh crore, with rising interest burdens and persistent revenue deficits indicating borrowing for consumption rather than asset creation. Welfare expenditure has expanded sharply, often around electoral cycles, while capital investment and infrastructure spending remain comparatively constrained. Weak own-tax growth, a low credit-deposit ratio, modest FDI inflows, factory closures, and an overwhelmingly micro-dominated MSME base collectively signal structural economic underperformance and limited industrial transformation. |
I. Debt trajectory and fiscal deficit expansion
- When the TMC took office in 2011, they inherited a debt of over ₹1.92 lakh crore.[51] By the end of the 2025-26 fiscal year, that figure is projected to skyrocket to over ₹7.7 lakh crore, a nearly four-fold increase in 15 years. As of the 2025-26 Budget Estimates, outstanding liabilities are pegged at ₹7,71,670 crore.[52]
- Per capita debt has risen to approximately ₹70,653 per citizen, raising serious concerns about the ‘debt trap’ being passed to future generations. While the ratio has technically dropped from 40.6% (2011) to roughly 37.98% (2025-26 BE),[53] it remains significantly higher than the median for Indian states, leaving the state with very little fiscal breathing room.[54] The real cause of concern for the West Bengal government on this count is the interest payment on the accrued debt.[55]
| On average, West Bengal’s interest payments account for approximately 20% to 28% of revenue receipts, the second highest among major states after Punjab. In comparison, most states operate in the 5% to 15% range, indicating substantially greater fiscal headroom.[56] |
- The state’s fiscal deficit has consistently exceeded the statutory limits set by the FRBM Act, often requiring one-time relaxations. The fiscal deficit for 2024-25 (Revised Estimates) reached 4.0% of GSDP, significantly higher than the budgeted 3.6%.[57] This indicates repeated fiscal slippage, where actual spending outpaces planned revenue.
- Unlike many states that borrow to build infrastructure, West Bengal continues to run a high Revenue Deficit (2.38% in 2024-25 RE).[58] This means the state is borrowing money to finance its current expenditure such as salaries and subsidies. This fiscal imbalance suggests that the West Bengal government is stuck in a revenue deficit-driven borrowing cycle, where it borrows not to create productive assets like roads or industries, but simply to fund its day-to-day operations and populist subsidies.
- Between 2020-21 and 2024-25, the state accumulated a revenue deficit of ₹1.49 lakh crore, while total capital expenditure during the same period was ₹2.7 lakh crore. In terms of scale, the cumulative revenue deficit was equivalent to 55.9% of total capital spending, illustrating the magnitude of resources absorbed by recurring expenditure pressures. To sustain this imbalance, the state has relied heavily on borrowing, with market borrowings constituting around 80% of total capital receipts in 2024–25 and being used in significant part to finance the revenue account rather than build long-term assets.[59]
- The fiscal landscape of West Bengal is characterised by a significant commitment to social welfare, which in turn shapes the state’s broader expenditure patterns and investment capacity. In 2025-26, West Bengal is estimated to spend ₹1,48,013 crore on committed expenditure, which is 56% of its estimated revenue receipts.[60] This comprises spending on salaries (28% of revenue receipts), interest payments (18%), and pension (10%). In 2023-24, as per actual figures, 65% of revenue receipts were spent towards committed expenditure.[61] This leaves roughly 44% of revenue for all other departmental activities, including healthcare, education, and development projects.
- The state currently utilises nearly one-fifth (18%) of its revenue receipts solely for interest payments.[62] This requirement to service old debt reduces the discretionary fund available to the state for initiating new infrastructure projects without additional borrowing.
- While the 2025-26 budget targets a 35% increase in capital outlay (to ₹39,338 crore) compared to revised estimates, actual spending in this sector has historically lagged behind targets. Reports indicate that capital outlay was underspent by an average of 33% between 2015 and 2021, as funds are often prioritised for revenue-expenditure obligations.[63]
- The allocation and actual utilisation of funds for long-term infrastructure in West Bengal reflect a prioritisation of immediate revenue-based obligations over budgeted capital projects.
II. Revenue vs. welfare expenditure imbalance
- West Bengal’s revenue growth remains sluggish, with limited own-tax revenue avenues that are heavily dominated by state excise. The state’s SGST collections have grown at an average rate of only 6.6% annually over the past five years.[64]
- The Centre’s share in the revenue receipt was 55.87% in 2020-21,[65] and even though it is projected to decline slightly to 52.30% in 2025-26,[66] still a larger chunk of state’s revenue receipts comes from the centre.
- The contribution of ‘hard to tax’ sectors in West Bengal’s GSDP is significantly worrisome. Based on recent analyses, West Bengal faces a significant fiscal challenge with a high share of its GSDP originating from informal, agricultural, and small-scale sectors, which are notoriously difficult to tax. This has led to a stagnant tax-to-GSDP ratio, with the state’s own tax revenue hovering around 5.45% of GSDP as of 2023-24, which is below the national average.[67]
- The problem is not episodic but deeply entrenched. West Bengal’s Own Tax Revenue-to-GSDP ratio has ranked the lowest among Indian states in 8 out of the last 9 years covered in the assessment.[68] This persistent underperformance reflects structural weaknesses in tax buoyancy, limited industrial diversification, and an economic base dominated by sectors that yield relatively low and unstable tax collections. As a result, the state continues to face an increasing pressure on its fiscal resources while struggling to expand its revenue base.[69]
- Between 2019-20 and 2023-24, West Bengal’s cumulative non-tax receipts were 40% lower than its own budget estimates, partly due to chronic shortfalls in interest receipts.[70]
- The Bengal Budget allocates a large share of expenditure to social welfare. Approximately ₹73,000 crore has also been allocated for the social category.[71] Even though this is a large share of money, various reports and data have flagged corruption and money not reaching the actual beneficiaries.
- West Bengal’s spending on physical infrastructure has declined from 5.3% of total expenditure in 2018-19 to just 3% in 2022-23, below the national average.[72]
- This fiscal imbalance sits within a context of long-term economic underperformance. West Bengal, which held the third-largest share of national GDP at 10.5% in 1960-61, now accounts for only 5.6% in 2023-24. Its per capita income was 127.5% of the national average in 1960-61 but has declined to 83.7% in 2023-24.[73]
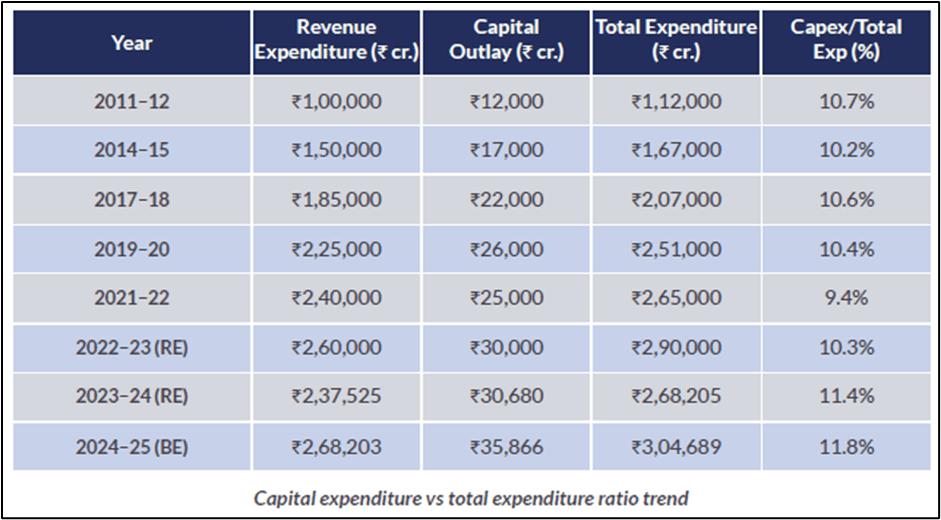
- The fiscal consequence of this welfare overspending/expenditure pattern is that capital expenditure, the kind that drives long-term growth, has been squeezed. In 2024-25 (BE), revenue expenditure (₹2.68 lakh crore) is nearly 7.5 times the capital outlay (₹35,866 crore), and committed expenditure alone absorbs 58% of revenue receipts. Although budget allocation estimates (BE) to education (15.6%), health (6.6%), agriculture (7.4%), and rural development (6.2%) exceed the all-state average, capital-intensive sectors such as roads and bridges (1.9% vs 4.6% state average) and energy (1.2% vs 4.7%) remain structurally under-allocated.[74][75]
- West Bengal ranked 16th out of 18 states in NITI Aayog’s Fiscal Health Index 2026. Interest payments account for ~20% of the state’s total revenue receipts, severely limiting its ability to allocate funds for developmental projects.[76] The state also ranks 17th in both Revenue Mobilisation and the Debt Index, indicating that its fiscal challenges stem not only from current deficits but from deeper structural weaknesses in resource generation and debt sustainability.
III. Credit-deposit ratio and investment climate
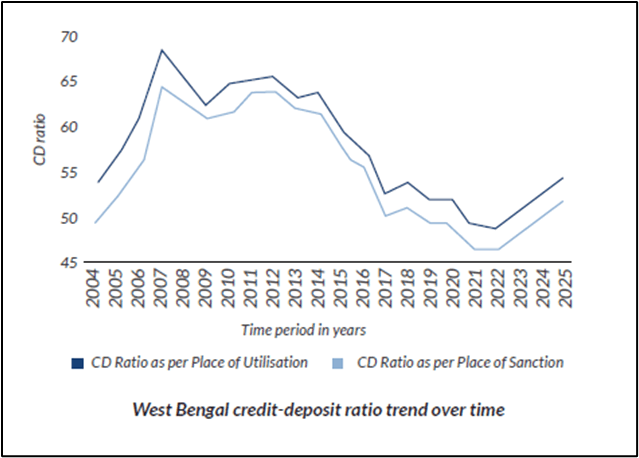
- The Credit-Deposit (CD) ratio measures what proportion of a bank’s deposits are deployed as credit (loans/advances) within a state. Based on the Economic Survey 2025-26,[77] the following table shows the CD ration in West Bengal:
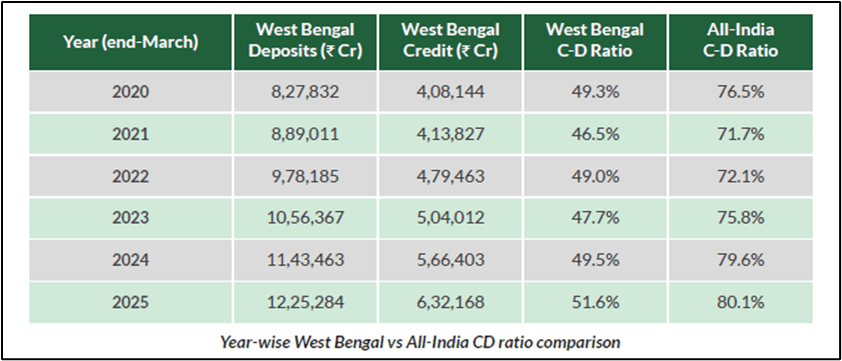
- West Bengal’s C-D ratio has persistently hovered in the 46-52% range, roughly 25-30 percentage points below the national average throughout this period. A persistently low ratio signals weak credit absorption, meaning banks collect savings from local households but lend them out elsewhere, indicating insufficient local economic demand or business activity.
- A January 2026 SBI Research report[79] directly addresses the disparity issue in West Bengal’s CD ratio and notes that West Bengal is “lagging” as the CD ratio is “continuously declining” and remains “stuck at very low levels.” The same report notes that states such as West Bengal are witnessing movement of deposits from banks towards financial markets at a faster pace, indicating savings are being channeled into equity and mutual funds rather than reinvested locally as credit, further straining the ratio.
- The state has consistently announced massive investment figures that have yet to materialize into a transformed industrial landscape. Despite the fanfare of the Bengal Global Business Summit (BGBS), the Central Government’s Department for Promotion of Industry and Internal Trade (DPIIT) indicates that only 4.16% of investment proposals have actually moved beyond ‘pen and paper’. [81]
- Disclosure in the State Assembly reveals that industrial stability has weakened; while 83 factories closed during the previous administration, that number has surged to 177 closures under the current tenure, including 94 large and mid-level units.[82] The closure of these units has resulted in the direct loss of 29,084 jobs, contributing to a climate where West Bengal has become a primary exporter of cheap migrant labor for menial jobs in other states.[83]
- Between October 2019 and 2025, FDI inflows in West Bengal stood at ₹15,256.66 crore (US$ 1,946.00 million).[84] However, in comparative terms, one analysis reports that West Bengal received FDI of only ₹2,534 crore in the last fiscal (2024-25) and did not feature in the top 10 FDI destinations of India by state.[85]
| One of the main reasons for low Foreign Direct Investment (FDI) is the lack of a robust manufacturing sector. The state economy is dominated by sectors that traditionally attract less FDI, such as real estate, agriculture, and small-scale services. Additionally, state policy discourages intervention in land acquisition for private industrial projects. This approach is reinforced by Section 14Y of the West Bengal Land Reforms Act, 1955, which stipulates that any individual or company wishing to hold land beyond the standard ceiling (about 24 acres) for industrial purposes must obtain specific, case-by-case approval from the state government.[86] |
- As per the Ministry of Corporate Affairs, 6,600 companies including 110 listed companies shifted their base out of West Bengal between 2011 to 2025.[87] During 2016 to 2021, a total of 21,521 factories were shut down, according to the Department of Environment of West Bengal. In 2023, Care Rating survey dragged West Bengal down to 24th in the economic parlance.[88]
IV. MSME and industrial growth claims vs. data reality
Per the live MSME Ministry dashboard, West Bengal’s current MSME breakdown under Udyam (since July 2020) is as follows[89] :
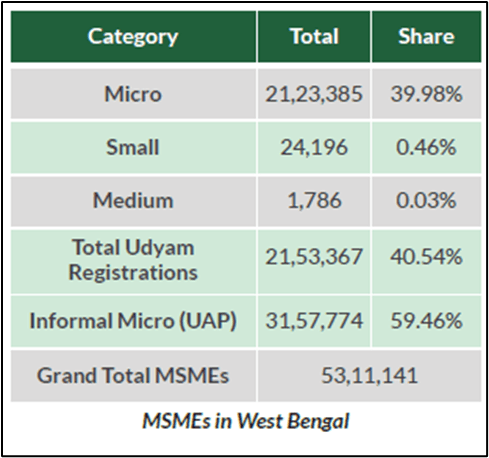
| West Bengal’s 53 lakh+ MSMEs, an overwhelming 40%, are classified as Micro enterprises, the smallest possible category, with investments under ₹1 crore. Only 1,787 enterprises qualify as Medium indicating that the state’s MSME ecosystem is overwhelmingly a collection of tiny, subsistence-level units, not a robust industrial base. The 31.5 lakh “Informal Micro Enterprises” (UAP registrations) which dominate the count are the smallest, most fragile, financially excluded micro-enterprises home-based units with no formal credit access.[91] |
- In 2015, the informal firms accounted for more than 95% of the total manufacturing firms in the state, hosting 93% of the total workers in the manufacturing sector.[92] Further, 99% of the informal enterprises possess plants and machinery of value less than ₹25 lakh, making them micro enterprises even under the previous, broader MSME definition.[93]
- These informal firms who are almost equivalent to the entire manufacturing sector of the state account for a paltry 0.01% of the total gross capital formation of the state and 0.02% of the total gross value added per enterprise.[94]
- As per the unincorporated enterprise survey 2015-16, only 7% of the informal firms got access to loans from any external sources, amounting to a paltry 0.003% of the total outstanding loans of the sector. Not even 1% of informal enterprises received any financial support from the government, central and state combined.[95]
- In the last decade (2011-2016), the compound annual growth rate of gross value added for West Bengal was 2.7% whereas that of all India was 6.4%. According to the Annual Survey of Industries, the state slipped from 9th rank at all-India level to 11th rank in terms of net value addition in the last decade.[96]
Assessing the economic record of the post-2011 period requires moving beyond political claims and examining measurable outcomes. The following chapter therefore evaluates four key macroeconomic indicators that provide a clearer picture of West Bengal’s economic performance under the TMC government – Gross State Domestic Product (GSDP) Growth Trends, Per Capita Income vs. National Average, State Debt-to-GSDP Ratio, Capital Expenditure vs. Revenue Expenditure Ratio.
Chapter 5: Four Key Macroeconomic Indicators Under TMC
| West Bengal’s share in national GDP has steadily eroded since 2011, with growth consistently trailing the national average, marking a “lost decade” of prolonged relative decline. Per capita income has fallen sharply in rank and now stands significantly below the national average, reversing historical advantages. Simultaneously, elevated debt levels, persistent revenue deficits, and low capital expenditure ratios indicate fiscal stress driven by consumption-led spending rather than productive investment. Collectively, these trends point to deepening economic stagnation and a widening divergence from India’s broader growth trajectory. |
I. Gross State Domestic Product (GSDP) Growth Trends
- The central mandate of the regime change in 2011 was to reverse the shrinking of West Bengal’s economic footprint and restore its status as a growth engine. When the current administration assumed power, West Bengal contributed approximately 6.7% to India’s national GDP[97] but it has declined to merely 5.5% in FY 24-25.[98]
- This figure had already collapsed from a high of 10.5% in 1960–61 under the weight of the Left Front’s industrial dismantling. Under the current dispensation, West Bengal’s share of the national economy has further eroded, failing to keep pace with the expansion seen in western and southern states.[99]
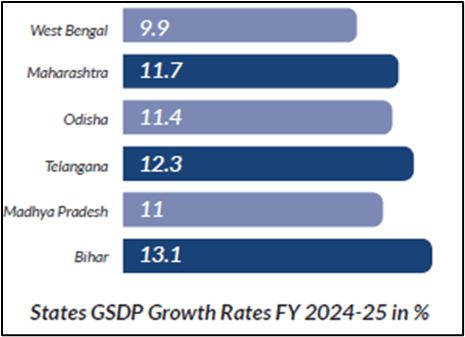
- West Bengal’s GSDP growth was recorded at 9.91% (real) in FY 24-25, which is one of the lowest GSDP growth rates amongst comparable states.[101]
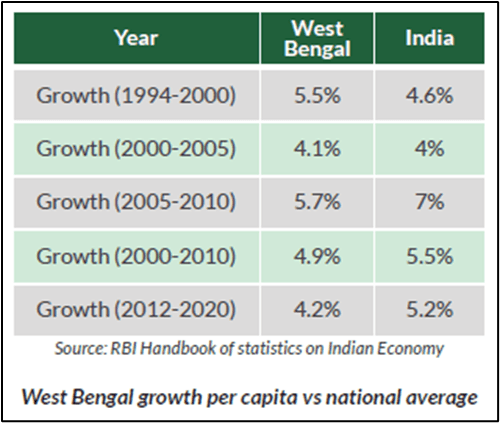
- The state has effectively decoupled from India’s high-growth trajectory, reducing its stature from a national economic powerhouse to a regional laggard that contributes progressively less to the national pie. The primary driver of this shrinking share is a persistent growth deficit relative to the rest of India. Between 2011–12 and 2019–20, West Bengal’s annual growth in real terms averaged just 4.2%.[103]
- This significantly lagged behind the national average of 5.2%. This 100-basis-point gap is not merely a statistical anomaly; it represents a “lost decade” of foregone wealth creation. While the national economy was accelerated by infrastructure spending and service sector expansion, West Bengal’s economy acted as a brake on national growth rather than a contributing engine.
II. Per Capita Income vs. National Average
- The state’s per capita income stood at 127.5% of the national average in 1960–61, and behind only Maharashtra and Gujarat among all states.[104]
- By 1980–81, it had already declined to approximately the national average. By the early 1990s, the rank of West Bengal had fallen to seventh. By 2000, it had fallen to tenth. By 2011, when the TMC came to power, it stood at eleventh.
- West Bengal’s rank fell further to fourteenth by the early 2020s, and its relative per capita income had declined to 83.7% of the national average by 2023-24, falling below that of several states that had historically lagged behind West Bengal.[105]
III. State Debt-to-GSDP Ratio
- West Bengal’s debt in FY 24-25 stood at ₹ 7.06 lakh crore, an increase of 11.44 % above its debt in FY 23-24.[107]
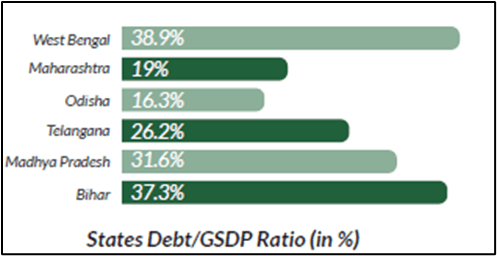
- West Bengal’s Debt/GSDP ratio stands at 38.9%[108] in FY 24-25, which far exceeds the targets given under the 15th Finance Commission and is the highest among major state economies.
- West Bengal is one of the eleven states in India to have a revenue deficit which is fifth highest in India and stands at 1.7% in FY 24-25 (BE).[110]
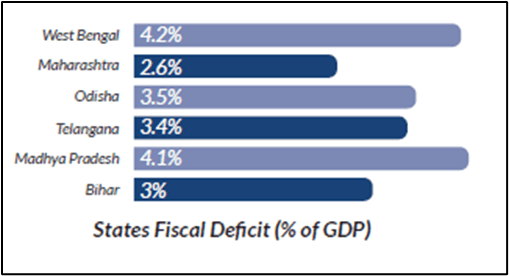
- West Bengal’s Fiscal Deficit runs at 4.02% of GSDP (Revised Estimates),[111] higher than the 15th Finance Commission recommendation of 3%.
- West Bengal’s Interest Payment to Revenue Receipts stands at 20.3%, highest among comparable states, posing risk to productive expenditure and raising concerns about debt sustainability.[113]
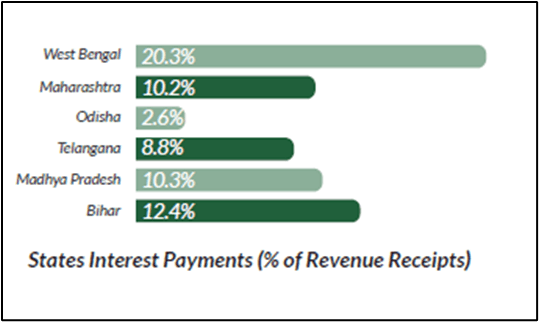
| State | Interest Payment (Cr) | Revenue Receipts (Cr) | IP/RR (in %) |
| West Bengal[115] | 46,215 | 2,27,591 | 20.3% |
| Telangana[116] | 17,730 | 2,02,108 | 8.8% |
| Madhya Pradesh[117] | 26,877 | 2,62,009 | 10.3% |
| Odisha[118] | 5,500 | 2,14,000 | 2.6% |
| Maharashtra[119] | 54,687 | 5,36,463 | 10.2% |
| Bihar[120] | 20,526 | 2,44,443 | 12.4% |
- The most damaging dimension of West Bengal’s debt profile is not the total quantum, but the composition of borrowing. A revenue deficit means the state is borrowing to finance current consumption rather than investment.
- West Bengal allocates only about 10% of its developmental expenditure to capital expenditure, against approximately 27% for the better-performing states.[121]
IV. Capital Expenditure vs. Revenue Expenditure Ratio
- Capital outlay in West Bengal’s budget, the most direct measure of public investment, has hovered at approximately 10-12% of total expenditure throughout the TMC period. The national average for state capital expenditure as a share of total state expenditure was approximately 15-18% for most years in this period.[122]
- West Bengal’s capital expenditure in FY 24-25 (RE), stood at ₹ 60,992 Crores.[123] Capital expenditure accounts for only 18.4% of West Bengal’s total expenditure, with revenue expenditure being nearly 4.5 times higher.[124]
| It is important to note that capital expenditure includes not only capital outlays but also repayment of loans. For example, in 2025-26(RE) capital expenditure of Rs. 60,661.24 crore, more than a half, Rs. 33,795.10 was for loan repayments. Hence, not only is the state of West Bengal out of money, but it is also forced to borrow for servicing its liabilities and committed expenditures, instead of being able to spend on development that could create durable productive assets. |
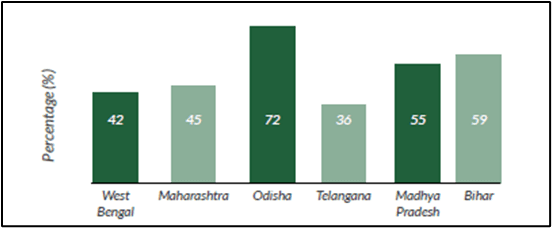
- West Bengal’s total expenditure-to-GSDP ratio of 16.5% is below the median, meaning the state is not just underspending on capital, it is underspending overall.[126] West Bengal’s productive expenditure is 42% of state expenditure, the second lowest among comparable states in India.[127]
Macroeconomic indicators provide an overview of the state’s economic health, but they also reflect deeper structural trends within the productive economy. Among the most significant of these is the steady relocation of industries and businesses away from West Bengal, which delivered a decisive blow to employment opportunities and scope for the state’s economic growth. The next chapter explores this industrial exodus in detail.
Chapter 6: Industrial Exodus – The Flight of Physical and Financial Capital
| Since 2011, West Bengal has witnessed a sustained and structural flight of industry, with 6,688 companies, including 110 listed firms, relocating out of the state, signaling deep erosion of investor confidence. The exodus goes beyond cyclical slowdowns and it reflects governance-driven uncertainty marked by policy reversals, weak contract enforcement, fiscal stress, and an entrenched ‘syndicate’ economy that imposes informal costs on industry. High debt, low capital expenditure, stagnant FDI inflows, and declining industrial output share have placed Bengal in a macroeconomic trap, sharply diverging from high-growth states like Gujarat, Maharashtra, and Uttar Pradesh. The cumulative result is de-industrialisation, MSME decline, labour out-migration, and shrinking national economic share, indicating a structural crisis of competitiveness rather than a temporary downturn. |
I. Major Industries That Exited Bengal: Scale, Sequence, and Structural Pattern
- West Bengal’s industrial decline is not a recent phenomenon, but the post-2011 period under the Trinamool Congress represents a qualitatively distinct phase – one characterised not by cyclical contraction but by structural, sustained capital flight.
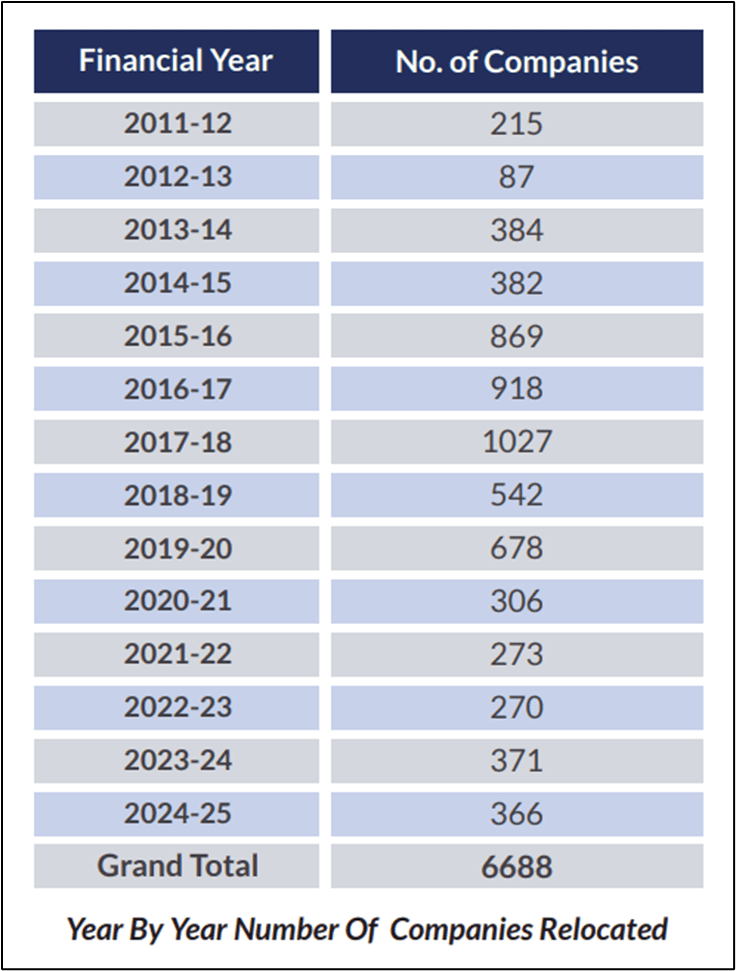
- The aggregate numbers, sourced from Ministry of Corporate Affairs (MCA) data disclosed in Parliament, establish the scale unambiguously. Between 1st April 2011 and 30th September 2025, 6,688 companies relocated their registered offices out of West Bengal. Of these, 110 were listed companies – not marginal entities, but firms with established balance sheets, market capitalisation, audited financials, and employment footprints. The destinations were overwhelmingly Maharashtra, Gujarat, Uttar Pradesh, Tamil Nadu, and Karnataka.[129]
- The rate of exit is as significant as the volume. Year-by-year MCA data reveals the following trajectory: [130]
- Three observations from this data demand particular attention.[132]
- First, the peak exit years – FY 2016-17, FY 2017-18, and FY 2018-19 coincide precisely with TMC’s political consolidation following the 2016 Assembly elections, not with any external macroeconomic shock as the state Government claims, such as demonetisation or GST transition, both of which affected all states equally.
- Second, over 2,200 companies exited in just the five years between 2019 and 2024, demonstrating that this is not a legacy issue resolving itself over time, but an active, ongoing governance failure.
- Third, the most recent data point – 366 companies in FY 2024-25 gives no indication of reversal despite the state Government’s repeated claims of an ‘industry-friendly’ administration.
- The composition of departing firms further undercuts the Government’s narrative. High-value listed companies that exited Bengal include Netweb Technologies, Gallant Ispat, Eureka Forbes, JK Tyre, Greenpanel Industries, among others. These are not shell companies or fly-by-night operators; they are established enterprises with supply chains, skilled workforces, and institutional memory.[133]
- The Government’s counter-argument that 1,30,000+ new companies have been registered in Bengal since 2011 fails basic analytical scrutiny. The overwhelming majority of these entities are micro or informal-scale registrations: street vendors, small traders, and single-person operations brought under formal classification by regulatory requirements. They are structurally incapable of offsetting the employment, output, and supply-chain multipliers generated by anchor manufacturers and listed firms.
- Although the Singur episode technically predates the TMC Government’s assumption of power in May 2011, it is analytically inseparable from the Mamata Banerjee era – because it was her agitation, her political choices, and her implicit governance philosophy that produced it. The expulsion of the Tata Nano project, which had committed ₹1,500 crore and would have generated an estimated 10,000 direct and indirect jobs in Hooghly district, sent a strong signal to the national and global investor community: industrial investment in West Bengal is politically contingent and reversible.
- That signal has never been corrected. It was compounded by the downsizing of the Salboni integrated steel project[134] and the complete abandonment of the Nayachar chemical hub[135], both of which were interpreted through the Singur lens. No comparable big-ticket manufacturing investments replaced any of these projects. Entire districts were left de-industrialised, with no alternative economic architecture offered in substitution. Capital does not merely pursue incentives, it pursues predictability. What Singur announced, and what fifteen years of subsequent governance has confirmed, is that West Bengal struggles to offer both.
II. Comparative investment inflows: Bengal vs. Gujarat, Maharashtra, UP, Odisha and Assam
- West Bengal’s Macroeconomic Trap
- Debt-to-GSDP Ratio: West Bengal’s fiscal space is severely constrained by its historical debt pile. As of the recent FY24/FY25 estimates, Bengal’s Debt-to-GSDP ratio hovers alarmingly around 35-38%. This debt burden heavily limits the state’s ability to borrow for fresh infrastructure, as a massive portion of its annual budget is consumed simply by interest payments on historical loans.[136]
- Fiscal Deficit: While the FRBM framework generally recommends a fiscal deficit limit of 3% of GSDP, West Bengal routinely estimates and frequently breaches the 3.5% to 4% mark. Fiscal deficit for 2024-25 was targeted at 3.6% of GSDP (₹68,250 crore). In 2023-24, as per the revised estimates, the fiscal deficit was expected to be 3.5% of GSDP, lower than the budget estimate (3.8% of GSDP).[137] Fiscal deficit for 2025-26 is targeted at 3.6% of GSDP (₹73,178 crore).[138] Crucially, this deficit is often driven by unfunded welfare commitments rather than capital asset creation. The state frequently struggles with revenue deficits, meaning it is forced to take market loans simply to pay salaries, pensions, and run daily administrative schemes.
- This macroeconomic weakness directly bleeds into investor confidence. Despite being India’s fourth-most populous state, Bengal captures merely 0.6% to 1% of the national Foreign Direct Investment (FDI), securing less than $300 million in recent full-year tallies. This macroeconomic weakness directly undermines investor confidence. Despite being India’s fourth-most populous state, West Bengal captures only a marginal share of national Foreign Direct Investment (FDI). According to official data from the Department for Promotion of Industry and Internal Trade (DPIIT), the state received approximately $394 million in FDI during 2022-23. The state fails to attract greenfield foreign capital in high-tech manufacturing, remaining highly dependent on legacy sectors.[139][140]
- Annual Investments and CapEx Anemia: The most critical differentiator for growth is the quality of state expenditure. Capital Expenditure (Capex) in West Bengal often constitutes less than 10% to 12% of its total budget, sharply below the national state average.[141] For the 2025-26 (Budgeted Estimates), total net expenditure is targeted at ₹3,41,462 crore. The Capital expenditure is projected at ₹39,338 crore. This amounts to 11.5% of the total budget.[142]
- Furthermore, the conversion rate of signed investment MoUs at state summits into grounded, operational projects remains historically low.[143]
- GSDP Growth Rate Volatility: While Bengal occasionally posts nominal GSDP growth rates in the double digits, its real growth rate over the last decade has struggled to consistently outpace the national average. Its share of the national GDP has systematically shrunk over the last three decades, dropping from 6.8% in 1990-91 to roughly 5.8% today.[144]
B. Maharashtra: High Growth, High FDI, Controlled Debt Maharashtra operates in a completely different macroeconomic league. Despite its massive state budget, Maharashtra maintains a deeply comfortable Debt-to-GSDP ratio of roughly 18-20%. This immense fiscal headroom allows the state to consistently absorb 30% to 39% of India’s total FDI (attracting $15B-$19B annually).[145][146] The state leverages its low deficit to fund massive infrastructure corridors without ever risking a debt trap, resulting in consistently robust real GSDP growth.
C. Gujarat: Gujarat combines low debt with extreme industrial expansion. Gujarat routinely posts one of the lowest Debt-to-GSDP ratios among major states (around 15-18%) and maintains a fiscal deficit comfortably below 2%.[147][148] This strict fiscal discipline translates directly into infrastructural superiority. The state attracts $5-7 billion in FDI annually.[149]
D. Uttar Pradesh: Leveraging Deficits for Capital Creation UP’s macroeconomic story is one of aggressive structural transformation. At the end of 2025-26, Uttar Pradesh’s outstanding liabilities is estimated to be 29.4% of GSDP, lower than the revised estimate for 2024-25 (30.8% of GSDP)[150], its borrowing is strictly funneled into physical asset creation; UP allocates a massive 20%+ of its budget to Capital Expenditure. Because of this pivot toward expressways and defence corridors, UP’s economic growth rate is actively outpacing the national average, recently attracting over ₹33 lakh crore in domestic investment intentions at its Global Investors Summit.[151]
E. Odisha: Revenue Surplus Odisha is a masterclass in mineral-backed fiscal management. The Odisha Economic Survey 2025-26 estimates its Debt-to-GSDP ratio at a remarkably healthy 13.6%[152], one of the lowest in the country. The state frequently records revenue surpluses and boasts a projected real GSDP growth of 7.9% for 2025-26 (beating the national average). Because it doesn’t need to borrow for daily expenses, it absorbs massive domestic capital (over ₹5.66 lakh crore in recently approved projects) to expand its steel, mining, and IT sectors.[153]
F. Assam: While Assam’s Debt-to-GSDP ratio sits moderately around 25-28%[154], its fiscal trajectory is heavily growth-oriented. Assam has systematically increased its capital outlay, aggressively utilizing 50-year interest-free loans from the Centre to build infrastructure. This macroeconomic pivot from a low-base economy to an infrastructure-led model is precisely why mega-investors are choosing to ground high-tech hardware projects there-evidenced by the Tata Group’s ₹27,000 crore semiconductor facility.[155]
G. Comparative Synthesis: Why the Macro Gap Translates to an Investment Gap
- The Debt-to-CapEx Tradeoff: The starkest comparison lies in how debt is utilised. When Uttar Pradesh or Gujarat borrow, the capital is overwhelmingly directed toward infrastructure (CapEx), generating future economic returns. Conversely, West Bengal’s high fiscal deficit is largely driven by revenue expenditure (salaries, pensions, and welfare schemes). An investor comparing these states clearly sees that competing states are building the physical assets required for modern manufacturing, while Bengal is merely servicing legacy debt or incurring more debt to fund revenue expenditure.
- Fiscal Space for Policy Predictability: Capital craves predictability, which requires a healthy state treasury. Because states like Odisha (13.6% debt-to-GDP) and Gujarat (18% debt-to-GDP) have immense fiscal headroom, they can guarantee and honor long-term tax subsidies to mega-industries. In direct comparison, Bengal’s highly stressed fiscal condition forces desperate revenue-generation measures such as the retrospective withdrawal of the 1993 industrial incentive schemes which destroys institutional trust and drives capital away.
- The ‘Crowding Out’ of Private Investment: When a state government like Bengal runs high fiscal deficits to fund daily expenditure, it absorbs a massive chunk of available domestic bank credit. This “crowding out” effect leaves fewer financial resources for local businesses, directly correlating with Bengal’s lagging 8% MSME credit growth rate compared to the national average of 15%[156]. Maharashtra[157] and Gujarat’s[158] low fiscal deficits ensure that banks have ample liquidity to lend to private enterprises, spurring grassroots annual investments.
- Diverging Growth Rate Trajectories: Ultimately, these parameters culminate in the GSDP growth rate. States like UP, Odisha, and Gujarat are experiencing a virtuous cycle: high CapEx leads to better infrastructure, which attracts massive FDI and domestic investment, which in turn drives real GSDP growth well above the national average. West Bengal is caught in a vicious cycle where high debt and low CapEx repel private capital, keeping its proportional share of the national GDP in a slow, decades-long decline.
III. The Perception Gap and Its Structural Causes
- The Government of India’s Business Reform Action Plan (BRAP) rankings[159], conducted by DPIIT in coordination with the World Bank, provides the most standardised state-level assessment of the regulatory environment. Bengal’s trajectory across these rankings is directionally consistent and consistently downward:
- 2016: Ranked 6th nationally a figure the state government has cited repeatedly as evidence of reform momentum
- 2017-18: Dropped to 10th
- 2019: Ranked 18th
- 2020-21: Placed in the ‘Aspirers’ category a tier below the ranked states – Note that states like Andhra Pradesh and Gujarat maintained their top-tier status in these corresponding DPIIT assessments.
- The specific reform pillars on which Bengal systematically underperforms include: construction permit approvals, labour regulation enforcement, contract enforcement timelines, land acquisition transparency, and environmental clearance timelines. The deterioration is not a single-year anomaly; it is a monotonic decline spanning a decade of the same government.
- On contract enforcement the single most critical indicator of business confidence in a jurisdiction – Bengal’s commercial courts are among the most burdened in India. An investor committing capital to a jurisdiction must factor in the cost of legal remedy if a contract is breached; in Bengal, that remedy is effectively unavailable within a commercially meaningful timeframe. This massive judicial bottleneck is visibly reflected in the millions of pending state cases tracked on the National Judicial Data Grid (NJDG).
- The September 2025 decision by the Bengal government to retrospectively scrap industrial incentive schemes dating back to 1993 deserves particular analytical attention, as it distills the state’s investment climate failure into a single administrative act. Firms that had planned and committed investments based on assured GST refunds, power subsidies, stamp duty concessions, and commitments made by the Government of West Bengal in legally documented agreements, suddenly faced clawbacks with no transitional arrangement.
- Birla Corporation and Dalmia Bharat alone absorbed losses estimated at ₹430 crore as a direct consequence of this decision. Both companies indicated intent to pursue litigation and review further Bengal-based expansion plans. The message transmitted to every firm with existing or contemplated Bengal exposure was unambiguous: contractual commitments made by the Government of West Bengal are politically disposable. This move via the newly notified Revocation of the West Bengal Incentive Schemes Act, 2025, has sparked massive concern and ongoing legal challenges across India Inc.[160]
- The Calcutta High Court, in multiple rulings between 2019 and 2023, has directly observed that law enforcement in Bengal has been subject to political interference, particularly in matters involving ruling party affiliates. These are not opposition claims or think-tank assessments; they are on-record judicial observations by constitutional courts, carrying the evidentiary weight that such observations demand.
IV. Law & Order and the Syndicate Economy: The Informal Tax on Investment
- The Syndicate System as a Structural Feature: The relationship between Bengal’s political economy and its industrial stagnation cannot be fully captured through regulatory metrics. A structural feature of Bengal’s operating environment, one that predates TMC but has deepened measurably in the post-2011 period is the syndicate system, a network of politically affiliated extortion operators that exercise de facto control over construction materials, transport logistics, labour deployment, and local clearances.[161]
- The ‘Cut Money’ Parallel Taxation: Industry testimony across sectors converges on a single diagnosis. TMC-linked syndicate networks impose what amounts to a parallel taxation system on productive activity. ‘Cut money’ demands informal payments extracted as a condition for routine project operations that directly contribute to destroying competitiveness and introducing arbitrary political risk into every investment decision. Critically, Mamata Banerjee herself publicly acknowledged the prevalence of syndicates within her party in 2019, yet no meaningful dismantling followed. The acknowledgement without consequence served only to confirm the system’s political protection.[162]
- Militant Labour Relations and the ‘Gherao’ Culture: Labour relations under TMC rule have compounded this environment. Militant ruling-party-aligned unions routinely engage in enforced stoppages, intimidation of non-affiliated workers, and direct political interference in workforce management decisions. Industry surveys consistently place West Bengal near the bottom on labour regulatory predictability. These practices echo the gherao culture associated with the Left Front era, the very culture whose economic consequences Bengal spent decades recovering from and have similarly suppressed labour-intensive manufacturing investment.
V. Macro-Economic Consequences: The Arithmetic of Decline
The aggregate consequences of sustained industrial flight and investment deficit are now visible in Bengal’s macro-economic structure:
- Capital formation: For the 2024-25 fiscal year, West Bengal budgeted a Capital Outlay of just ₹35,866 crore against a GSDP of ₹18.8 lakh crore. This means the state is dedicating a historically low 1.9% of its GSDP to capital formation. Furthermore, between 2015 and 2022, the state recorded a massive average underspending of 33% on its capital outlay budgets.[163]
- MSME sector collapse: Bengal’s MSME sector has been poorly performing, with 2,227 closures between 2019 and 2024 per MCA data. MSME credit growth at 8% annually versus the national 15% reflects a financing environment hostile to small manufacturer survival.[164]
- What emerges from these indicators, taken in aggregate, is a coherent structural pattern: An economy progressively converting from production to welfare dependency, from industrial employment to remittance reliance, from capital attraction to capital flight. West Bengal’s share of national industrial output, its FDI capture rate, its MSME vitality, its youth employment absorption, and its fiscal capacity to finance recovery are all moving in the same direction simultaneously.
The movement of capital rarely occurs in isolation. As industries relocate and job opportunities shrink, labour markets inevitably adjust. In West Bengal’s case, the outward movement of businesses has been accompanied by distress-driven large-scale migration of workers seeking employment elsewhere. The following chapter analyses this phenomenon.
Chapter 7: Labour Migration: The Silent Referendum
| Labour migration from West Bengal has intensified in recent years, with an estimated 22.4 lakh workers employed outside the state by 2025, reflecting deep-rooted rural distress and limited local employment opportunities. The large-scale corruption in MGNREGA allocation, industrial decline, and persistent underemployment have pushed workers toward informal and low-skilled sectors in states like Kerala, Karnataka, Maharashtra, and Delhi. While remittances provide short-term relief and sustain household consumption, they have also created patterns of dependency and family separation, with women bearing increased social and economic burdens. Seasonal, circular migration now functions as a ‘silent referendum’ on governance and development, highlighting systemic economic vulnerabilities. |
I. Labour Migration: The Silent Referendum
Labour migration from West Bengal has emerged as a poignant indicator of underlying economic and governance challenges, often described as a ‘silent referendum’ on the state’s development trajectory. With roots in historical industrial decline and persistent rural vulnerabilities, this phenomenon reflects a broader narrative of unfulfilled promises in employment generation and welfare delivery. Drawing from recent data (2024-2026), including government reports, academic studies and media analyses, this section explores the multifaceted dimensions of out-migration. Key sources include the Economic Advisory Council to the Prime Minister’s working papers, Periodic Labour Force Surveys (PLFS), and field-based inquiries, revealing a scale of movement that underscores systemic failures while highlighting resilience through remittances.
Economic Distress related out-migration from West Bengal has grown significantly, with official estimates placing the number of interstate migrant workers at approximately 22.4 lakh in 2025, though unofficial figures suggest it could be higher. This movement is largely from rural areas, where unemployment and low agricultural productivity push workers toward urban centers in other states. Recent data from the Economic Advisory Council to the Prime Minister (EAC-PM) highlights West Bengal as a major source of migrants, sending more workers than the combined South and West Indian states (excluding Rajasthan) according to railway passenger trends.[165]
Rural West Bengal faces acute distress, exacerbated affecting over 70 lakh workers. This has resulted in unpaid wages, increased debt and forced migration. Unemployment rates in rural areas remain high, with the Periodic Labour Force Survey (PLFS) 2023-24 showing limited non-farm opportunities. Industrial decline, as detailed in historical analyses, has compounded the crisis, pushing workers into precarious informal jobs elsewhere.[166]
A. Out-migration to Kerala, Karnataka, Maharashtra, and Delhi
- West Bengal ranks among India’s top sources of inter-state migrants, with approximately 22.4 lakh workers employed outside the state as of September 2025, according to the West Bengal government. This figure aligns with earlier Census 2011 data, which recorded 33.4 million total migrants in the state (including in-migrants), but recent trends indicate a focus on specific destinations driven by economic pull factors.[167]
- Kerala hosts 7-10 lakh Bengali workers, primarily in construction and informal sectors, attracted by better wage rates. Karnataka and Maharashtra draw migrants to urban hubs like Bengaluru and Mumbai for manufacturing and services, with EAC-PM’s 2024 analysis of railway unreserved ticket data showing West Bengal’s out-migration surpassing combined flows from southern and western states (excluding Rajasthan). Delhi serves as a northern gateway, absorbing workers in retail and domestic roles.[168]
- Seasonal and circular migration patterns dominate, with peaks during agricultural off-seasons. A 2025 study using NSS 64th Round data (2007-08, updated with 2024 PLFS) estimates that 40-50% of migrants from West Bengal engage in short-term moves, often facilitated by contractors.[169]
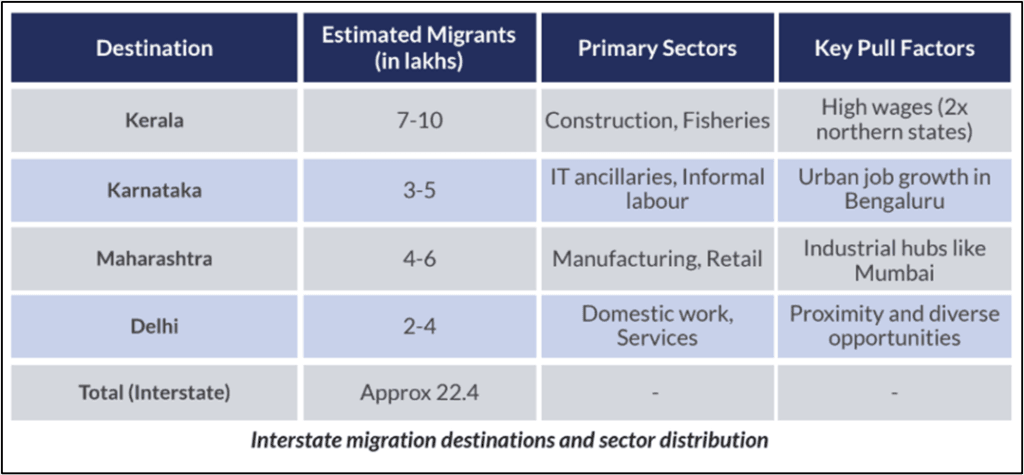
B. Construction, Informal Labour, and Domestic Workforce Migration
- Migrants from West Bengal predominantly enter low-skilled, informal sectors, with construction accounting for 60% of flows to Kerala and Karnataka, per a 2025 ILO-linked report. Informal labour, including waste picking in Bengaluru, absorbs another 20-30%, often under exploitative conditions.[170]
- Domestic work, particularly in Delhi and Maharashtra, engages women and youth, though female migration remains lower (47.9% national female migration rate per PLFS 2020-21, but region-specific data shows 20-30% from West Bengal).[171]
- Data reveals patterns tied to agricultural cycles, with workers from rural West Bengal (e.g., Purulia district) migrating en masse to brick kilns in Tamil Nadu or factories in Telangana.[172][173]
C. Employment Crisis and Distress
- National Statistical Office data from the Periodic Labour Force Survey 2023-24 shows rural unemployment at around 4 to 6% officially, the combination of underemployment and disruptions in welfare delivery has deepened economic distress in many rural districts.[174][175]
- Industrial decline, as analysed in Subhash Ray’s 2011 paper (updated contexts in 2024 EAC-PM), has eroded formal employment, pushing workers into precarious out-migration.[176]
- The debts are mounting in rural Bengal, with families skipping meals.[177]
D. Impact on Families and Remittance Dependency – Based on the responses of the labor who migrated to other states from West Bengal.
- Migration’s family impacts are dual-edged: Remittances alleviate poverty but foster dependency and social disruptions. A study estimates remittances improve household welfare, with 62-70% used for consumption, education and debt repayment.[178]
- However, family separation affects 75-80% of migrants (men often migrate alone), leading to women’s increased burdens and children’s educational disruptions.The 2022 PMC analysis shows rag pickers in Bengaluru as exceptions, living with families but in poor conditions.[179]
- Dependency risks are evident: The remittances create ‘remittance-dependent communities’ limiting productive investments.[180] COVID-19 amplified vulnerabilities, with data showing uncertain job access post-lockdown, pushing families into debt.[181]
Chapter 8: Dilapidated Infrastructure and Investment Bottlenecks
| West Bengal’s infrastructure reflects structural stagnation across power, logistics, ports, and urban governance, creating cumulative deterrents to industrial investment. The state’s power sector remains coal-heavy and transition-lagging, with poor renewable energy adoption and persistent reliability concerns that weaken industrial competitiveness. Logistics performance has stagnated below the national average, while inadequate road capacity and limited integration with national initiatives such as PM Gati Shakti have increased freight costs relative to peer states. Despite its strategic maritime location, port underutilisation and limited non-major port development have squandered Bengal’s coastal advantage. Compounding these challenges, Kolkata’s chronic municipal fiscal stress constrains capital investment, reinforcing a broader perception of governance-linked infrastructure bottlenecks that tilt investment decisions away from the state. |
I. Road and Logistics: The Cost of Connectivity Failure
- Infrastructure quality’s impact on investment is mediated most directly through logistics costs. A manufacturer who must absorb higher freight costs per unit, due to poor road quality, congested corridors, or inadequate multimodal infrastructure, operates at a competitive disadvantage that no industrial incentive package can fully offset. On this metric, Bengal’s position is deteriorating relative to peers even as the national picture improves.
- The Logistics Ease Across Different States (LEADS) framework, administered by DPIIT, provides the most systematic state-level benchmarking of logistics performance in India. West Bengal’s logistics score in 2025 stands at 3.00, against an India average projected to reach 3.15, and against leading performers Gujarat, Tamil Nadu, and Karnataka, scoring between 3.75 and 3.95. Bengal’s score is characterised as ‘stagnant’ in independent assessments, without meaningful improvement across successive LEADS editions.[182]
- The specific structural weaknesses driving this underperformance are well-documented. National Highway corridor capacity between Kolkata and the industrial hinterland, Durgapur, Asansol, and Haldia, remains constrained. The Kolkata-Delhi NH2 corridor carries industrial freight volumes that its lane capacity and pavement condition do not adequately support. State road investment, as a proportion of total state expenditure, has been consistently crowded out by welfare spending commitments, a fiscal trade-off that does not register in headline growth statistics but accumulates as an invisible competitive disadvantage.
- The PM Gati Shakti initiative, which has sanctioned 434 projects valued at ₹11 lakh crore nationally, has not translated into equivalent momentum in Bengal, in part because the state’s own complementary investment in last-mile industrial connectivity has not kept pace. States that have most effectively leveraged Gati Shakti, including Gujarat, Uttar Pradesh, and Telangana, have done so by proactively developing state-funded feeder infrastructure to connect Gati Shakti nodes to industrial clusters. Bengal’s participation has been more passive.[183]
- Uttar Pradesh provides the most striking logistics trajectory comparison. The state’s logistics score has risen significantly post-2017, driven by the Purvanchal Expressway, Jewar Airport development, and active industrial cluster connectivity investment. UP now generates approximately $18[184] billion in leather and textile exports, categories with direct parallels to Bengal’s historical industrial base, from a logistics platform that a decade ago was considered far inferior to Bengal’s. The reversal of relative position is a direct consequence of governance divergence, not geography.
II. Port Underutilisation: Squandered Maritime Advantage
- West Bengal’s most underappreciated structural asset is its maritime infrastructure. The Syama Prasad Mookerjee Port (SMP), Kolkata, comprising the Kolkata Dock System and the Haldia Dock Complex, is India’s only major riverine port, serves as the primary maritime gateway for Nepal, Bhutan, Bangladesh, and the entire northeast of India, and sits at the intersection of India’s Act East Policy and its Bangladesh, Bhutan, India, Nepal (BBIN) regional connectivity agenda. The potential is substantial and geopolitically unique. The utilisation record tells a different story.
- In FY 2022-23, SMP Kolkata (including Haldia) handled 65.66 million tonnes of total cargo, a record figure for the port, and one that the state government has cited in investment promotion materials. However, the context provided by comparative port data reframes this record significantly.
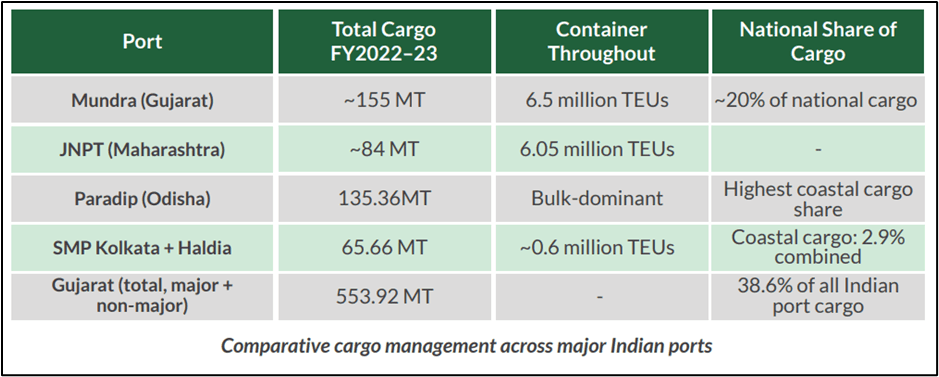
- The port’s physical constraints compound the governance failures. The Hooghly River’s siltation problem restricts vessel size; the port can handle ships up to 500 feet in length, excluding the Very Large Crude Carriers and New Panamax container vessels that modern port economics increasingly require. Continuous capital dredging is necessary to maintain navigational depth, imposing costs that reduce the port’s competitive attractiveness for private terminal operators.
- Crucially, Bengal has made no meaningful progress in developing non-major ports along its coastline to complement SMP. Gujarat’s non-major port sector handled approximately 439 MT of cargo in 2022-23, accounting for roughly 64% of India’s total non-major port cargo. Bengal’s non-major port sector is negligible by comparison. The state’s coastal potential, a structural advantage that most eastern Indian states lack, remains almost entirely underutilised as a commercial asset.[186]
III. Power Sector: Capacity Deficit, Transition Failure, and Industrial Unreliability
- Infrastructure is not merely a complement to investment; it is a precondition for it. A manufacturer evaluating a location weighs power reliability, logistics costs, and port access before weighing incentive structures. On each of these dimensions, West Bengal presents a picture of chronic underinvestment, stalled transition, and governance-induced stagnation that compounds the investment deterrence effects documented in the preceding section.
- As of December 2025, West Bengal’s total installed power generation capacity stands at 10,730.62 MW, of which state utilities account for 5,917.95 MW, the private sector for 2,809.93 MW, and central utilities for 2,040.74 MW. Of this total, thermal power accounts for 8,514.34 MW, approximately 79% of the installed capacity, with coal-based generation comprising over 80% of the thermal mix. Renewable energy sources account for a mere 770.98 MW, or approximately 7% of total installed capacity.[187]
- Contextualising this against peer states exposes the structural lag. Gujarat’s total installed capacity stands at approximately 66 GW, over six times that of Bengal, of which renewables constitute a substantial and growing share. Gujarat has built approximately 30% more renewable capacity than its MNRE target as of December 2025. The contrast is not simply one of scale: Gujarat’s power sector has been systematically rebuilt over two decades of consistent industrial policy. Bengal’s has been managed in maintenance mode.[188]
- The joint IEEFA-Ember Indian States’ Electricity Transition (SET) report, covering assessments for both 2023 and 2024, is unambiguous in its comparative verdict. West Bengal is categorised among the bottom-performing states in both iterations alongside Jharkhand, across the report’s three dimensions of decarbonisation, readiness of the power ecosystem, and market enablers. The report’s language is clinical: “comparatively low performance across several parameters over two iterations of this report suggests structural challenges.”[189]
- The renewable energy utilisation data makes the structural failure concrete. As of February 2024, West Bengal had harnessed just a small percentage of its renewable energy potential, excluding large hydroelectric capacity. Distributed solar energy, among the fastest-growing categories nationally, constitutes a mere 4% of Bengal’s renewable installed capacity. In the current energy transition context, where industrial consumers increasingly require green power certification for export market compliance and ESG investor requirements, Bengal’s energy mix is not simply inefficient; it is becoming commercially disqualifying for the category of investors the state most needs to attract.[190]
- Industrial belts in Howrah, Hooghly, and North 24 Parganas continue to report voltage fluctuations and supply interruptions that impose hidden costs on manufacturing operations, costs that do not appear in official capacity statistics but materially affect production efficiency calculations.
IV. Urban Decay and Municipal Fiscal Stress: The Kolkata Problem
- An economy’s urban centres function as its investment showcase. The condition of a state’s primary city, its infrastructure, its fiscal health, and its liveability signal to investors what the broader governance environment looks like. On this dimension, Kolkata presents a persistently difficult picture that contradicts the cosmopolitan intellectual identity the city projects.
- The Kolkata Municipal Corporation (KMC) is the local government responsible for administering approximately 206 square kilometres of the city, housing a population of approximately 5 million within KMC limits and over 14 million in the broader metropolitan area. Its budget trajectory reveals chronic fiscal stress:
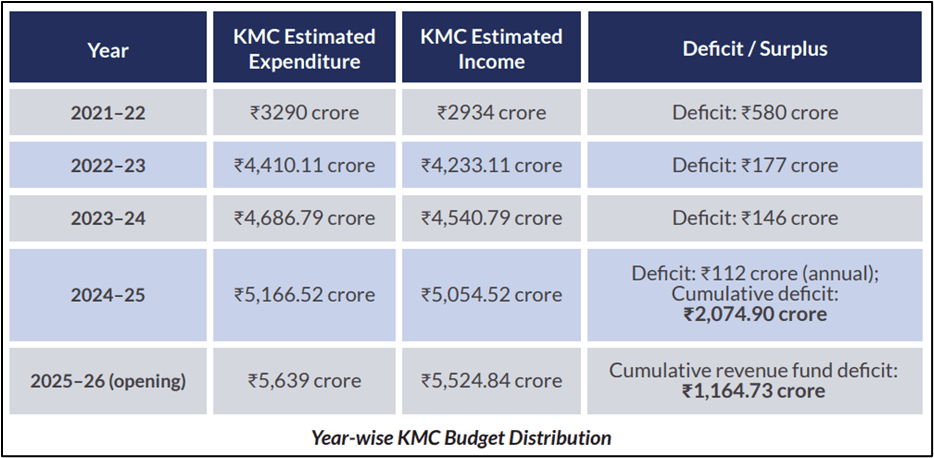
- The cumulative deficit figure of ₹2,074.90 crore as estimated for 2024-25 is the critical number here. It represents the accumulated shortfall between what KMC has spent and what it has collected over multiple years, financed through debt and central/state transfers. An urban body carrying a cumulative deficit of this magnitude cannot sustainably invest in capital infrastructure. Its expenditure priorities are determined by debt service obligations and salary commitments rather than by infrastructure investment logic.
- The allocation structure within KMC’s 2024-25 budget of ₹5,166 crore confirms this. Roads and transport infrastructure received ₹320 crore, approximately 6.2% of total expenditure. Solid waste management received ₹692.14 crore, water supply ₹408 crore, and health services ₹163 crore. While these allocations reflect genuine service requirements, the road allocation is insufficient for a city of Kolkata’s scale, age, and traffic density to maintain existing infrastructure, let alone expand it.[192]
- The urban infrastructure consequences of this fiscal constraint are visible on the ground. Kolkata’s road network, despite periodic high-visibility repair announcements, carries a pothole density and drainage failure rate that imposes measurable costs on industrial logistics, last-mile delivery, and daily commute time for the city’s workforce. The city’s stormwater infrastructure has not been modernised to accommodate either population growth or changing monsoon intensity, producing recurring inundation events in commercial and industrial zones.
- New Town (Rajarhat), developed as Kolkata’s planned IT and business district, has absorbed some investment but remains inadequately connected to the city’s rail and bus networks, limiting its attractiveness as an office location relative to comparable planned districts in Hyderabad, Pune, and Chennai.
- Kolkata is the only major Indian metropolitan city that has lost direct international flight connections over the study period. Lufthansa’s withdrawal from the Frankfurt route in 2012 left Kolkata with no direct flights beyond the Asian region, a connectivity gap that is not merely symbolic but materially affects the ability of multinational firms to base regional operations or senior management in the city.[193] The airport handled 21 million passengers in the year 2024[194], a figure that, while growing, remains well below the traffic volumes at Bengaluru (40+ million)[195], Hyderabad (27+ million)[196], and Chennai (22+ million)[197] cities, competing for the same category of investment.
- The four infrastructure dimensions examined here, power sector stagnation, logistics underperformance, port underutilisation, and municipal fiscal exhaustion, operate as compounding deterrents rather than independent constraints. A manufacturer weighing Bengal against Gujarat or Odisha encounters not a single disqualifying factor but an overlapping set of cost and reliability disadvantages that collectively tilt the location calculus decisively against the state.
- Infrastructure deficits of this kind are not corrected by investment summits. They require sustained capital allocation, regulatory reform, and governance continuity over multiple fiscal years, precisely the conditions that Bengal’s political economy has not provided.
Infrastructure constraints highlight the broader issue of fiscal priorities and the allocation of public resources. Understanding how Government spending is distributed across sectors provides insight into the policy choices shaping the state’s economic trajectory. The following chapter evaluates these budgetary priorities.
Chapter 9: Religious Community-Focused Budgetary Allocation and Fiscal Priorities
| This chapter analyses the sharp rise in West Bengal’s Minority Affairs and Madrasah Education budget, which has increased by over 1,100% since 2011-12 and now significantly exceeds allocations to key industrial and IT sectors. The state’s fiscal framework prioritises revenue-driven welfare expenditure, particularly scholarship schemes like Aikyashree, over capital formation and industrial growth. The 2026-27 Interim Budget reflects a structural tilt toward social spending, accompanied by high borrowings and limited capital investment. The chapter further examines the constitutional debates surrounding religion-linked allocations, including the Imam allowance controversy. |
I. Minority Affairs budget allocation trends
The Department of Minority Affairs and Madrasah Education (MA&ME) has witnessed unparalleled fiscal growth over the last 15 years. What began as a modest allocation to support traditional madrasahs has ballooned into a multi-thousand-crore socio-economic engine. West Bengal government’s Minority Affairs and Madrasah Education. The budget has risen by 1111.02% since 2011-12 to ₹5,713.61 Crore.[198]
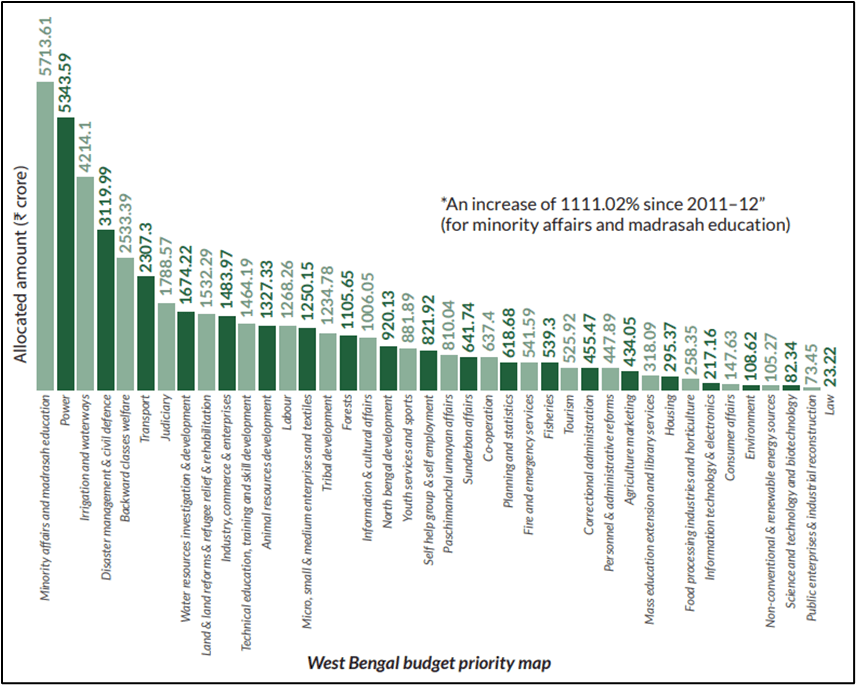
- Analysis of the West Bengal (interim) Budget 2026-27
To understand the magnitude of this allocation, it must be placed alongside other vital wealth-generating departments. In the 2026-27 Interim Budget[200] presented by Finance Minister Chandrima Bhattacharya:
- Minority Affairs & Madrasah Education: ₹5,713.61 crore
- Industry, Commerce & Enterprises: ₹1,483.97 crore
- Micro, Small & Medium Enterprises (MSME): ₹1,250.15 crore
- Information Technology & Electronics: ₹217.16 crore
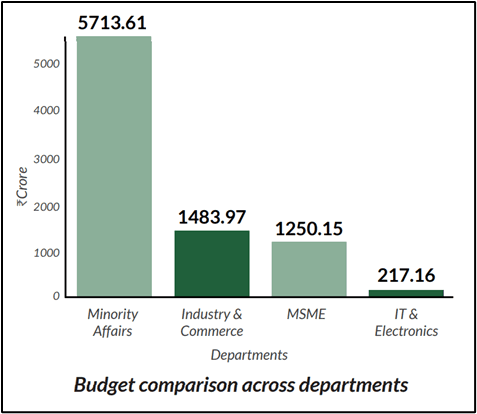
| The West Bengal government currently spends nearly four times more on Minority Affairs than it does on heavy industry and commerce and almost twenty-six times more than it spends on the IT sector. This clearly indicates a fiscal policy that prioritizes socio-economic welfare over traditional industrial expansion. |
II. Scholarship schemes and fiscal burden
The hyper-growth of the MA&ME budget is primarily driven by Direct Benefit Transfers (DBT), specifically in the form of educational scholarships. While hailed globally as an effective tool for social upliftment, it inherently creates a rigid fiscal burden.
- The ‘Aikyashree’ Phenomenon
Launched in 2019, Aikyashree[202] is the state’s flagship scholarship scheme for minority students.
Scale: It covers students from Class I up to Ph.D. levels. Since its inception, the state has disbursed to over 4.85 Crore beneficiaries through this portal.[203]
Financial Impact: Since its launch, the state has spent over ₹10,200 crore on Aikyashree scholarships, with minority affairs budgets of around ₹5,600 crore annually to fund such programs.[204] - Sharp rise in Madrasah Education Budget
West Bengal has sharply increased spending on madrasah education between 2011 and 2026. The 2011-12 budget speech records plan expenditure rising to about ₹310 crore[205] for madrasah development. Over the next decade the state expanded allocations for teacher pay, infrastructure upgrades, hostels, stipends and Scheme for Providing Quality Education in Madrasas(SPQEM)-linked grants and by 2023-24-25 headline allocations reported in state budgets rose to roughly ₹5,530 crore.[206] These large figures bundle direct madrasa instruction with wider minority-welfare outlays, complicating comparisons of classroom funding versus ancillary support.
III. Welfare politics vs. capital formation
The overarching theme of West Bengal’s economic policy between 2011 and 2026 is the decisive victory of ‘Welfare Politics’ over ‘Capital Formation’.
- The 2026-27 Budget Reality
The interim budget for 2026-27, sized at ₹4.06 lakh crore[207] perfectly encapsulates this ‘Bengal Model’:
- Total Revenue Expenditure: ₹3.09 lakh crore[208] (Funds used for salaries, pensions, subsidies, and welfare doles).
- Total Capital outlay of : ₹41,926.57 crore[209] (Funds used for building roads, bridges, hospitals, and industrial parks).
Nearly 46% of the state’s total expenditure (around ₹1.80 lakh crore) is dedicated exclusively to social services, welfare schemes and minority scholarships only, draining the budget meant for development of people of West Bengal. While the capital expenditure is really minimal when compared to the revenue expenditure.
2. The Economic Trade-Off
- The Stagnation of Industry: Because so much capital is tied up in revenue expenditure, the state is forced to rely heavily on market borrowings. In 2026-27, the state plans to borrow over ₹80,952.96 crore.[210]
- The Debt Trap: West Bengal’s committed expenditure (salaries, interest on debt, and pensions) eats up a major part of its total revenue receipts. When a government spends that much just to survive, it cannot invest in capital formation. This explains the massive disparity between the Minority Affairs budget and the Industry budget.
| This framework can be labeled as ‘appeasement economics’, sacrificing long-term industrialisation and job creation for short-term electoral dividends through targeted doles. |
IV. Constitutional and economic implications
The targeted allocation of state funds based on religious identity carries deep constitutional and long-term economic implications.
- The Constitutional Tightrope: The Imam Allowance Controversy
- Under Article 30 of the Indian Constitution, minorities have the right to establish and administer educational institutions, which gives the state a legal basis to heavily fund Madrasah education and Aliah University.
- However, the West Bengal government has gone a step further providing direct stipends to religious figures even bypassing the Judicial decisions. The TMC government announced a monthly honorarium of ₹2,500 for Imams and ₹1,000 for Muezzins.[211] In 2013, the Calcutta High Court struck this down as unconstitutional, ruling that squandering public exchequer funds based solely on religion violates the secular fabric of the Constitution.[212]
- To bypass the judicial block, the government routed the funds through the West Bengal Wakf Board. Today, the Wakf Board distributes these enhanced allowances (currently ₹3,000 for Imams and ₹1,500 for Muezzins[213]).
- While legally permissible as Wakf properties generate their own revenue supplemented by state grants, it remains a heavily contested issue regarding the secular nature of state resource distribution.
2. The Economic Implications
- Credit Rating and Fiscal Deficit: Continual borrowing to fund religious and social welfare keeps the state’s fiscal deficit hovering near the maximum permissible limit of 3.6% of the GSDP[214]. Rating agencies view this high ratio of revenue-deficit-to-fiscal-deficit negatively, as the borrowed money is not generating future financial returns.
Budgetary choices have consequences not only for macroeconomic stability but also for sector-specific livelihoods. One of the sectors most visibly affected by structural neglect and policy imbalance is the plantation economy, particularly tea gardens in northern Bengal. The next chapter explores this crisis in detail.
Chapter 10: Crisis in Tea Gardens and Plantation Economy
| North Bengal’s tea industry has entered a structural crisis marked by widespread estate closures, a 50-60% production slump and severe financial distress, with nearly 80% of organised gardens operating at a loss. Policy responses have prioritised land diversification and real estate interests over industrial revival, deepening economic instability. Wage stagnation, unpaid social security dues, and high levels of undernutrition and anemia have pushed plantation workers into a humanitarian emergency. However, the West Bengal government’s persistent refusal to acquire land for the Panitanki Integrated Check Post (ICP) has systematically stalled the Centre’s efforts to deploy advanced technical screening for incoming tea. The resulting collapse has triggered mass out-migration, trafficking risks, and long-term socio-economic alienation across North Bengal’s plantation belt. |
The tea industry, once the primary engine of North Bengal’s economy, has transitioned from a stable employment provider to a landscape of abandoned assets and systemic neglect. The current crisis is rooted in a policy environment that prioritises land-asset liquidation over industrial revival.
I. The Graveyard of Estates: Closed and Abandoned Tea Gardens
The phenomenon of closed or locked-out gardens has shifted from a cyclical occurrence to a permanent state of industrial sickness under the current administration.
- Systemic Attrition (2023-2025): According to official data from the Ministry of Commerce (March 2025), several high-profile gardens have entered a state of closure. These include Rungmook/Ceders, Moondakotee, Chongtong, Nagri, Ambootia, and Pandam in Darjeeling, as well as Dalsingpara, Ramjhora, and Dheklapara in Alipurduar.[215]
- The 2025 Production Collapse: By late 2025, tea production in the North Bengal plains slumped by nearly 50% to 60% compared to the previous year. This was driven by a dual assault of erratic weather and a devastating looper caterpillar infestation, which the state failed to mitigate through timely agricultural intervention.[216]
- Fiscal Fragility of Owners: The Indian Tea Association (ITA) reported in October 2025 that 80% of organised tea estates in the region are operating at a cash loss, with average auction prices falling by ₹16.87 per kg while production costs continue to spiral.[217]
- Land Policy as a Distraction: Rather than reviving production, the State Government’s Tea Tourism Policy (Amended 2024-25) allows for 30% of plantation land to be used for non-tea commercial activities.[218] Analysts view this as a mechanism for land-asset liquidation, where the Short Term Settlement (STS) scheme facilitates the entry of real estate interests into distressed gardens rather than restoring the plantation economy.
II. Wage stagnation and malnutrition
The transition of the tea belt from ‘the land of gold’ to a zone of ‘silent starvation’ is documented through clinical and economic data
- Wage Paralysis and the Minimum Wage Myth
The state has consistently failed to provide a statutory minimum wage, leaving workers dependent on ad-hoc ‘interim’ increases that do not track inflation.
- The Decade of Stagnation: The minimum wage advisory committee constituted in 2015 has met over 20 times in 10 years without coming to a meaningful outcome so that the welfare of the tea plantation workers can be ensured.[219]
- The Wage Gap: A glaring regional disparity is exposed by government records, which show that states like Sikkim pay ₹500 and other states in southern India pay approximately ₹440, the daily wage in West Bengal stands at ₹250 which indicates a glaring administrative lapse.[220]
B. Clinical Starvation: The Malnutrition Data
The correlation between estate closures and worker mortality is now empirically documented.
- The Under-Nutrition Metric: A study in the Alipurduar district revealed that 36.1% of tea workers are clinically undernourished, with 87.9% suffering from widespread anaemia.[221]
- Excess Mortality: In closed gardens like Madhu and Garganda, reports indicate that nearly 100 people died in early 2025 alone due to hunger-related complications.[222]
- Body Mass Index (BMI) Crisis: In abandoned plantations, the prevalence of low BMI due to Chronic Energy Deficiency (CED) is among the highest in the state, with frontline workers in Anganwadi Centres (AWCs) struggling to provide even basic nutritional support due to a lack of state funding.
III. Export decline and policy paralysis
The global footprint of Bengal’s tea, specifically the world-renowned Darjeeling Geographic Indication (GI), is shrinking rapidly. This decline is not a natural market correction but the result of severe policy paralysis and the state government’s failure to protect its indigenous industries from predatory external dumping.
- The Nepal Dumping Crisis and Brand Dilution
The unregulated influx of cheap, inferior tea from neighbouring Nepal has structurally hurt the Darjeeling tea economy, with the state administration taking no effective countermeasures to protect local growers.
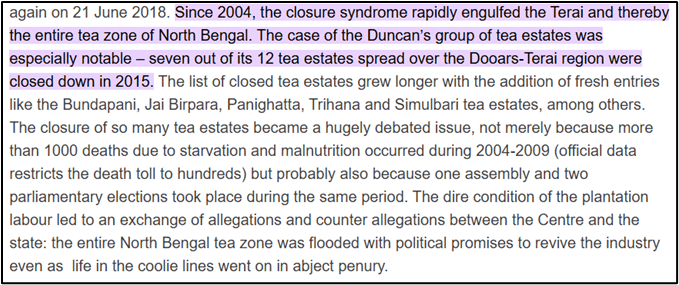
- The Import Surge: Total tea imports into India surged by 82% in 2024 to 44.53 million kg. Crucially, around 14 to 15 million kg of this was cheap orthodox tea from Nepal, which shares a similar physical character to Darjeeling tea but is produced at a fraction of the cost.[224]
- Cannibalisation of the GI Tag: This imported Nepal tea is routinely blended and passed off as premium Darjeeling tea in the domestic market. The state government has failed to implement robust supply-chain audits, allowing this illicit blending to dilute the Darjeeling brand and depress auction prices.
- The Price-Cost Deficit: As a direct consequence, the basic demand-supply dynamic has collapsed. In 2025, the average auction price for Darjeeling leaf tea in Kolkata plummeted to ₹420.89 per kg, while the cost of production skyrocketed to approximately ₹650 per kg. No industry can survive such a continuous deficit.[225]
B. Plunging Output and Market Contraction
The failure to incentivise replantation or mitigate climate impacts has led to a historic contraction in output across North Bengal.
- Darjeeling’s Historic Low: Production in Darjeeling, which peaked at over 14 million kg in the 1990s, has been in a freefall. From January to November 2025, production hit an unprecedented low of just 5.19 million kg.
- Dooars/Terai Distress: The crisis is not limited to the hills. In the plains (Dooars and Terai), auction prices for CTC (Crush, Tear and Curl) and dust tea declined by 9.5% in mid-2025. The Indian Tea Association (ITA) has repeatedly warned that the financial sustainability of the entire West Bengal tea sector is at a breaking point.
IV. North Bengal’s economic distress
The collapse of the plantation economy has triggered a profound socio-economic crisis across Alipurduar, Jalpaiguri, and Darjeeling. The state government’s apathy has transformed a once-productive workforce into a desperate, migratory population.
- Forced Out-Migration as a Survival Strategy
With gardens closed or abandoning statutory obligations, out-migration has replaced the plantation as the primary economic lifeline for the Adivasi and Gorkha communities.
- Mass Exodus: The closure of nearly 80% of tea gardens in North Bengal has forced families into distress migration, leaving behind children and the elderly in heartbreaking conditions.[226]
- Informal Exploitation: With no alternative industrial ecosystem built by the state government in North Bengal over the last 15 years, these workers, historically skilled only in plantation labour, are forced to migrate to Kerala, Karnataka, and Maharashtra. There, they work as precarious, informal construction labourers, entirely outside the social security net.
B. Trafficking and the Collapse of Civic Safety
- The vacuum left by retreating tea companies and an absent state welfare apparatus has turned the closed gardens into hotspots for human trafficking and exploitation.
- The Trafficking Nexus: Intelligence and Social Sectors report indicates a disturbing correlation between estate closures and missing persons. In deeply distressed gardens, the incidence of child trafficking has spiked, with estimates suggesting 8 to 10 children go missing out of every 100 in severe cases to feed urban domestic labour and commercial exploitation networks.
- Women Bearing the Brunt: With male members migrating, the women left behind in the labour lines are forced into hazardous, unorganised daily wage labour, such as illegal riverbed stone crushing, further deteriorating their health and safety.
- Healthcare Gaps and Policy Choices: The state government’s decision to opt out of the Centre’s flagship health insurance programme, Ayushman Bharat, over branding and administrative disagreements has further complicated access to healthcare for vulnerable communities. In its place, the state introduced Swasthya Sathi. However, reports of periodic disputes and operational glitches with private hospitals have raised concerns about continuity of coverage, particularly for economically distressed tea garden workers who already face limited access to reliable medical infrastructure.[227]
C. Alienation via Tea Tourism
Rather than executing a structural industrial bailout, the state administration’s primary policy intervention has been real estate diversification. By raising the ceiling of plantation land permissible for non-tea commercial use (like resorts) from 15% to 30%, the government is effectively facilitating land alienation. This policy enriches corporate owners looking to exit the tea business while offering zero job security or land rights to the workers who have lived on these estates for generations.
Chapter 11: Conclusion
I. Part I: What Has the TMC Government Done?
The decade-long rule of the All India Trinamool Congress (TMC) under Mamata Banerjee represents not a structural transformation of West Bengal’s economy, but a political recalibration of an already stagnant system inherited from the Communist Party of India (Marxist) (CPI-M). While the Left hollowed out Bengal’s industrial base through militant trade unionism, hostility to private capital and ideological rigidity, the TMC did not dismantle this legacy. Instead, it overlaid it with an extensive welfare subsidy architecture that prioritised political consolidation over productive expansion.
- Expansion of Welfare Schemes
- The most visible feature of TMC governance has been the aggressive expansion of welfare schemes. Programs such as Kanyashree, Sabuj Sathi, Rupashree, Lakshmir Bhandar, Swasthya Sathi and Krishak Bandhu created a wide safety net that penetrated deep into rural and semi-urban Bengal. The government positioned itself as a benefactor, directly transferring benefits to students, women, farmers, and the poor.
- However, welfare expansion without parallel economic expansion leads to a redistribution of scarcity rather than the creation of wealth. The TMC government focused heavily on demand-side assistance but failed to strengthen the supply-side engines of growth.
- In a state where formal sector employment has stagnated for decades and industrial output never recovered from the collapse of the 1960s to 1980s, welfare has become a substitute for work. Instead of rebuilding manufacturing capacity or nurturing a robust MSME-to-large-industry pipeline, the administration deepened dependence on state support. The state increasingly functions as a distributor of subsidies rather than an economic catalyst.
- Rural Cash Transfer Model
- The underlying problem remains unchanged that Bengal’s workforce is disproportionately trapped in low-productivity agriculture and informal services. Cash transfers may smooth consumption, but they do not raise productivity. They do not build industrial corridors, ports, logistics hubs, technology parks, or export clusters. They do not generate scalable employment for Bengal’s educated youth, who increasingly migrate to other states for work.
- The rural cash-transfer model has functioned as a political stabiliser in a structurally fragile economy. It mitigates anger but does not resolve unemployment. It cushions poverty but does not eliminate it. It may generate political loyalty but not long-term prosperity.
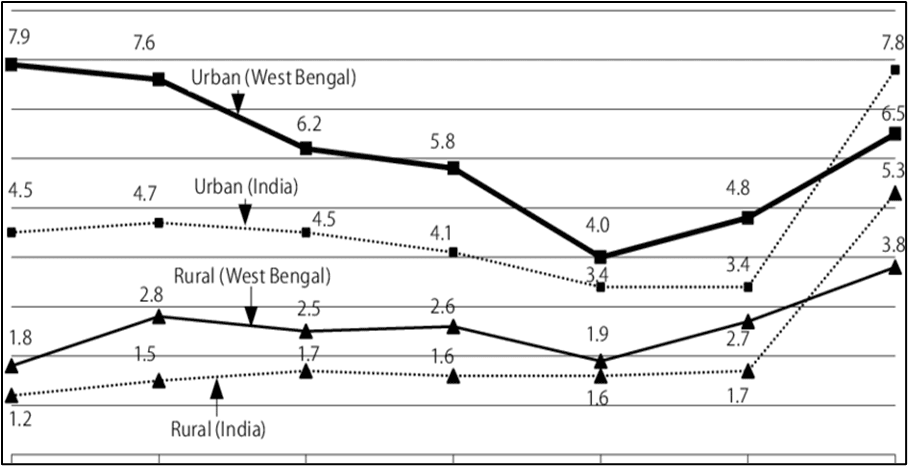
C. Political Consolidation Through Subsidy Architecture
- If the Left built its dominance through cadre networks and land reforms, the TMC consolidated power through welfare-linked patronage networks. Subsidies, club grants, rural contracts, local-level scheme implementation and government-linked ‘syndicates’ became instruments of political management.
- The architecture of welfare distribution often doubled as an architecture of local political control. Access to benefits was frequently mediated through local party functionaries. The ‘cut money’ irregularities in relief distribution after Cyclone Amphan and recruitment scams in education and civic bodies damaged institutional credibility. Even when corrective action was promised, the perception of politicised administration persisted.
- The problem is when welfare becomes a substitute for governance reform and economic planning. Political consolidation through subsidies may deliver electoral victories, but it does not create globally competitive industries or modern employment ecosystems.
- In effect, the TMC retained the Left’s scepticism of large-scale industrial capitalism while modernising its instruments of political mobilisation. The rhetoric shifted from class struggle to regional pride and welfare justice, but the structural hesitancy toward big-ticket industrialisation remained intact.
D. Debt-Funded Growth
- Perhaps the most concerning feature of the past decade has been the state’s rising debt burden. West Bengal’s outstanding liabilities have grown significantly, with a large portion of revenue receipts consumed by interest payments and salaries. Revenue expenditure has consistently overshadowed capital expenditure.
- Debt in itself is not inherently problematic if it finances infrastructure that expands future revenue capacity. But when borrowings fund recurring subsidies rather than productive assets, fiscal sustainability becomes fragile. Capital formation suffers. Infrastructure gaps widen. The state’s ability to co-finance central projects or attract private investment diminishes.
- Bengal today faces a paradox of high social expenditure, low capital investment, limited industrial revival and mounting debt obligations. This fiscal structure leaves very limited room for transformative public investment.
- The anti-industry reflex inherited from decades of Left rule, reflected in resistance to land acquisition during the Singur and Nandigram episodes was never meaningfully reversed. The TMC’s formal declaration that the government would not acquire land for industry signalled policy caution rather than strategic clarity. The result was policy drift.
I. Conclusion – Part II: Why Bengal Needs a Structural Economic Reset
West Bengal stands at an inflection point. Seven decades after Independence and four decades after the institutionalisation of Left-era economic habits, incremental adjustments will not suffice. What Bengal requires is a structural economic reset, one that moves beyond subsidy politics and confronts foundational constraints.
- Need for an Industrial Revival Strategy
Bengal was once India’s industrial nerve centre. In the early post-Independence years, it had the highest number of registered factories. Today, it lags behind states that were once far less industrialised.
An industrial revival strategy must begin with clarity: Which sectors can Bengal dominate in the 21st century? Potential areas include port-led logistics, agro-processing, textiles, leather, renewable energy components, defence manufacturing and information technology services. The industrial belts must be reimagined as an integrated corridor rather than a relic of the past. Without a credible industrial roadmap, welfare expansion will eventually hit fiscal limits.
- Fiscal Discipline and Capital Expenditure Prioritisation
A structural reset demands fiscal prudence. Revenue expenditure must be rationalised, leakages plugged and non-essential subsidies eliminated for efficiency. The state must gradually shift expenditure composition toward capital formation in roads, ports, power, irrigation, industrial parks and digital infrastructure. Public-private partnerships should be revived with transparent bidding processes. The state must improve its tax administration and widen its base without stifling enterprise. Borrowings should be strategically tied to projects that enhance productivity and expand the tax base.
Debt sustainability frameworks need strengthening. Fiscal transparency will also reassure investors and credit-rating agencies. Bengal cannot build its future on compounding interest liabilities.
C. Infrastructure Modernisation
Infrastructure is the backbone of industrial revival. Kolkata port modernisation, better connectivity to Northeast India and Bangladesh, expressways linking manufacturing clusters, expanded airport capacity and reliable power supply are essential.
- Urban infrastructure also requires urgent attention. Kolkata and secondary cities must become attractive for investment and skilled migration. Water supply, waste management, public transport and housing reforms are not cosmetic but they influence investor decisions.
- Digital infrastructure is equally vital. A knowledge-driven economy cannot flourish without broadband penetration, tech parks, startup incubators, and university-industry collaboration. Bengal’s intellectual capital is immense, but it must be harnessed through institutional partnerships rather than rhetorical nostalgia.
D. Restoring Investor Confidence and the Rule of Law
Perhaps the most critical requirement is restoring faith in the rule of law. Allegations of political violence, extortion syndicates, arbitrary enforcement and partisan policing deter serious investors. Economic revival requires legal predictability. Contracts must be enforceable. Property rights must be secure. Administrative processes must be insulated from political interference. Law-and-order stability is not merely a security concern, it is an economic imperative.
Political competition is legitimate in a democracy. But when elections are accompanied by violence and cadre-based intimidation, it sends negative signals to capital markets. Bengal must decisively reduce political volatility to rebuild credibility.
E. Employment-Led Growth Roadmap
The ultimate measure of economic success is employment. Bengal’s young population cannot subsist indefinitely on small cash transfers. They require dignified, productive jobs. An employment-led roadmap would include:
| Special focus must be placed on the young generation through educational access, entrepreneurship support and workforce integration, while keeping social justice embedded in economic expansion. |
West Bengal’s trajectory since Independence has been shaped by colonial extraction, central policy disputes, Left ideological dominance and post-Left welfare populism. The TMC has managed to outmanoeuvre the Left politically, but it has not dismantled the structural impediments that the Left entrenched.
The challenge now is not about replacing one party with another. It is about replacing a redistributive stagnation model with a production-driven growth model. Welfare must complement growth, not act as a substitute for it. Fiscal prudence must accompany compassion. Industrial revival must coexist with social equity.
If Bengal fails to undertake this reset, it risks institutionalising a model of mediocrity characterised by high welfare dependence, low growth, rising debt, and outward migration. If it succeeds, it can reclaim its historical role as an economic leader in eastern India and a gateway to South and Southeast Asia.