Executive Summary
This report assesses fiscal discipline across two administrations that shared the same executive leadership, Gujarat from 2001 to 2014 and the Union government from 2014 to 2026. It draws on a panel of 16 major states for FY2004-05 to FY2013-14 and on Union accounts rebuilt from Reserve Bank of India (RBI) rupee series through FY2024-25. Debt decomposition, audit findings and published studies of Gujarat’s power sector complete the evidence [1]-[3]. Table 1 places the two records side by side on the measures available for both.
| Gujarat | Union | |
| FY2004-05 to FY2013-14 | FY2013-14 to FY2024-25 | |
| Debt ratio, percent of output | 35.08 to 24.62 | 52.16 to 56.48 |
| Interest, percent of revenue receipts | 30.00 to 16.67 | 36.88 to 36.74 |
| Fiscal deficit, percent of output | 4.28 to 2.41 | 4.48 to 4.76 |
| Primary deficit, percent of output | 1.29 to 0.66 | 1.14 to 1.39 |
Findings for Gujarat
Gujarat’s consolidation rested on revenue. Between the first and last three years of the panel, the revenue account swung from a deficit of 0.51 percent of state output to a surplus of 0.67 percent. Own-tax collections rose from 6.43 to 7.65 percent, a gain exceeded only by Bihar, while only three states improved their revenue balance by more. As receipts grew, the share absorbed by interest fell from 25.62 to 16.73 percent, and capital outlay increased even as the fiscal deficit came down. The debt ratio declined by 10.45 points, close to the typical state’s fall, although this came from nominal growth rather than primary surpluses. Power reforms raised collections and cut losses, but the budget was still supporting the power companies with about Rs 5,862 crore in FY2012-13.
Findings for the Union
The Union reduced its deficits between FY2013-14 and FY2018-19 without lowering the share of receipts paid as interest. In FY2019-20 the primary deficit widened by 1.25 points of GDP, mostly because of higher primary spending, and a fall of about Rs 1.11 lakh crore in tax devolution passed much of the revenue shortfall on to the states. Since the pandemic peak of 9.16 percent, the fiscal deficit has come down, and capital expenditure rose from 12.50 percent of Union spending in FY2019-20 to 22.61 percent in FY2024-25. Food subsidy financing has moved onto the budget, while interest on bank recapitalisation bonds still adds to annual spending. The FY2025-26 revised estimate meets the Budget 2021-22 commitment of a deficit below 4.5 percent of GDP, but central liabilities in FY2024-25 stood 3.97 points above their FY2019-20 level, and the debt target has moved from 40 percent by March 2025 to 50 ± 1 percent by FY2030-31.
Implications
In both records, the periods in which the debt ratio fell owed that fall mainly to nominal growth rather than primary surpluses. The two difler in how the adjustment was made. Gujarat’s was broad, covering the revenue balance, own-tax revenue, interest absorption, capital outlay and guarantees, and its interest share fell by more than a third on the averaged comparison. At the Union level, deficit reduction and the shift towards capital spending came mainly after the pandemic, while interest has stayed near 37 percent of receipts. Deficit and debt ratios alone therefore do not capture the structure of fiscal adjustment, which also depends on revenue capacity, interest absorption, spending composition and the recognition of obligations.
1 . Scope and data
Narendra Modi was Chief Minister of Gujarat from October 2001 to May 2014 and has been Prime Minister since, but the two offices sit in different fiscal settings. A state borrows within limits agreed with the Centre and relies partly on central transfers. The Union, by contrast, is responsible for stabilising the economy and carries a far larger set of financial and intergovernmental commitments, and any comparison has to keep that difference in view.
The report asks how far Gujarat’s fiscal capacity improved and how the Union’s finances moved before, during and after the pandemic. It also asks which administrative and accounting decisions link the two periods. The answers draw on the accounts and on documents that record specific decisions, and they describe outcomes rather than attribute them to any individual.1
1.1 Data sources
The state data cover 16 major states from FY2004-05 to FY2013-14, with output at current prices on the 2004-05 base. They record revenue receipts and spending, own taxes, interest, liabilities, guarantees, social-sector spending and electricity losses. For Gujarat, an earlier series from FY1990-91 to FY2003-04 retains the RBI’s 2004 vintage [5], [6]. Fiscal deficits, primary deficits and capital outlay come from Tables 164, 167 and 174 of the RBI’s Handbook of Statistics on Indian States 2021-2S [1]. Across all 160 state-years, the gap between the fiscal and primary deficits matches the reported interest bill to within Rs 1 crore.
The Union data come from Tables 86, 87, 89 and 104 of the RBI’s Handbook of Statistics on the Indian Economy 2025-26 and begin in FY2000-01 [2]. Ratios are recalculated from rupee amounts over GDP from the Ministry of Statistics and Programme Implementation (MoSPI) on the 2011-12 base, using the latest revision for each year [3]. The newer 2022-23 base is not spliced in, and GDP for FY2026-27 applies the Budget’s 10 percent nominal growth assumption to the first advance estimate for FY2025-26. Combined Centre and state figures come from RBI Tables 239 and 240, with actuals running to FY2023-24 [7].
1.2 Comparison design
Gujarat is benchmarked against the unweighted median of the 16 states and checked against the other 15 alone. Because single years can mislead, the main comparison sets the average of FY2004-05 to FY2006-07 against the average of FY2011-12 to FY2013-14. The comparisons are descriptive, since leadership, shared national reforms, inherited debt and economic conditions all changed together. The results therefore cannot isolate the effect of one office-holder, and no composite score is built because the indicators measure different objectives.
2. Why a falling debt ratio is not enough
2.1 Five tests of fiscal discipline
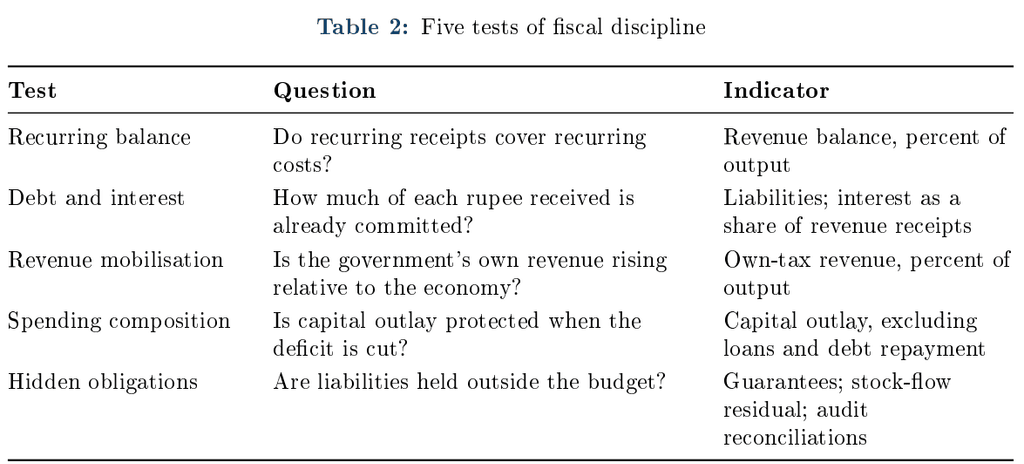
Government accounts have two parts. The revenue account holds recurring costs such as salaries, pensions, subsidies and interest, while the capital account holds spending on assets such as roads and irrigation, along with loans and equity purchases that may create no physical asset at all. Table 2 lists the five tests applied across both.
2.2 How growth shrinks a debt ratio
Each year the change in the debt ratio is the sum of four terms, and Figure 1 shows how they moved Gujarat’s ratio over the decade. Interest on existing debt and the primary deficit, which is borrowing for everything other than interest, add to the ratio. Nominal growth reduces it by enlarging the economy relative to the debt carried forward. A stock-flow residual captures whatever the reported deficit does not explain, such as a build-up of cash, valuation changes or changes in coverage.
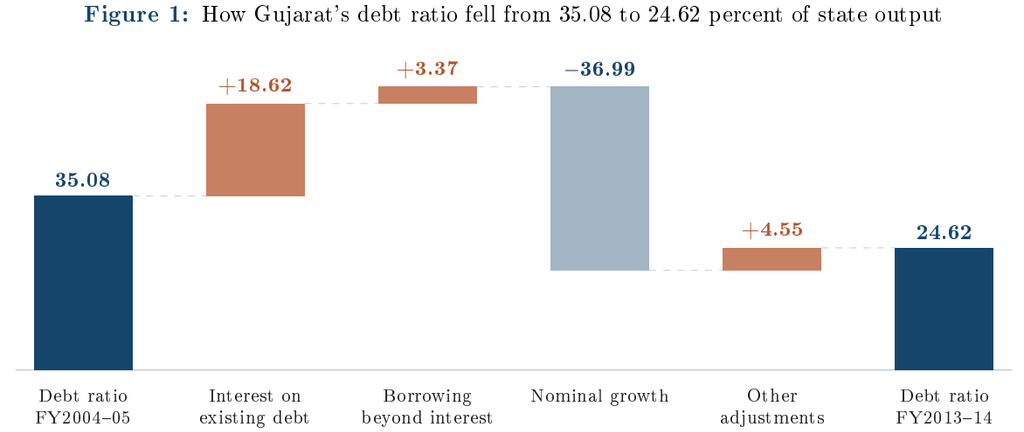
When growth runs ahead of the interest rate, the ratio can decline for years even as the stock of debt grows and the primary account stays in deficit, but that decline reverses if growth slows. Nor is a primary deficit proof of indifference to debt, because the standard sustainability test asks whether the primary balance improves as the debt ratio rises [9]. The sections that follow therefore keep the growth effect apart from the government’s own adjustment.
3. Gujarat started from a weak position
3.1 Borrowing paid for recurring costs
By the turn of the century Gujarat was borrowing heavily to meet recurring costs. Its revenue deficit grew from Rs 1,017.8 crore in FY1997-98 to Rs 6,302.2 crore in FY2000-01, rising from about 9 percent to 40 percent of revenue receipts. In FY2001-02, the year in which the chief minister changed, interest claimed 26.31 percent of receipts. The state was also absorbing the cost of the January 2001 earthquake, and the comparable state panel begins in FY2004-05.
3.2 National reforms helped every state
Several national measures opened the same route for every state (Table 3). The debt-swap scheme let states retire expensive central loans with cheaper money. The Twelfth Finance Commission’s relief facility rescheduled eligible central loans over twenty years at 7.5 percent for states with fiscal responsibility laws, and tied further relief to performance [10], [11]. Gujarat enacted its law in 2005 and introduced value added tax rules from 1 April 2006 [12], [13].
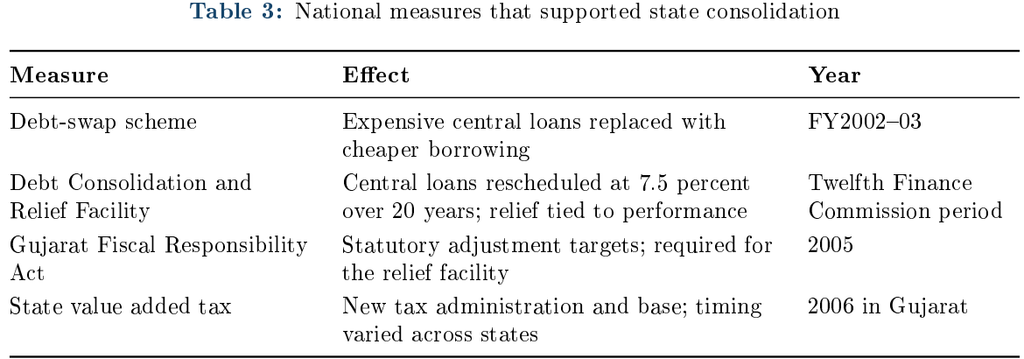
Each measure worked through a different channel, whether lower financing costs, a broader tax base or binding targets. The economy added its own support, as Gujarat’s nominal state output rose 15.87 percent a year between FY2004-05 and FY2013-14. Because these forces acted on every state, the comparison in Section 5 is needed to establish what Gujarat did differently.
4. Gujarat built fiscal capacity
4.1 Interest fell to under 17 paise per rupee
Table 4 compares the averages at each end of the panel, and every line except the primary deficit points to greater fiscal capacity.
| Percent of state output | First 3 years | Last 3 years | Change |
| Revenue balance (surplus positive) | −0.51 | 0.67 | 1.17 |
| Own-tax revenue | 6.43 | 7.65 | 1.21 |
| Capital outlay | 2.54 | 2.83 | 0.29 |
| Fiscal deficit | 2.94 | 2.25 | −0.69 |
| Interest payments | 2.65 | 1.80 | −0.84 |
| Primary deficit | 0.30 | 0.45 | 0.15 |
| Interest, percent of revenue receipts | 25.62 | 16.73 | −8.89 |
Measured year to year, interest fell from 30.00 percent of revenue receipts in FY2004-05 to 16.67 percent in FY2013-14, freeing about 13 paise of every rupee for other uses. The improvement came from receipts rather than a smaller interest bill. Interest payments rose from Rs 6,079 crore to Rs 13,332 crore over the decade, while revenue receipts grew close to fourfold, from Rs 20,265 crore to Rs 79,976 crore.
Own-tax revenue rose from 6.37 to 7.36 percent of state output between the end years, touching 8.18 percent in FY2012-13. The 1.21-point gain on the averaged comparison shows that the result does not depend on the choice of end year. Because the measure reflects realised collections, it combines tax policy, compliance and growth in the tax base.
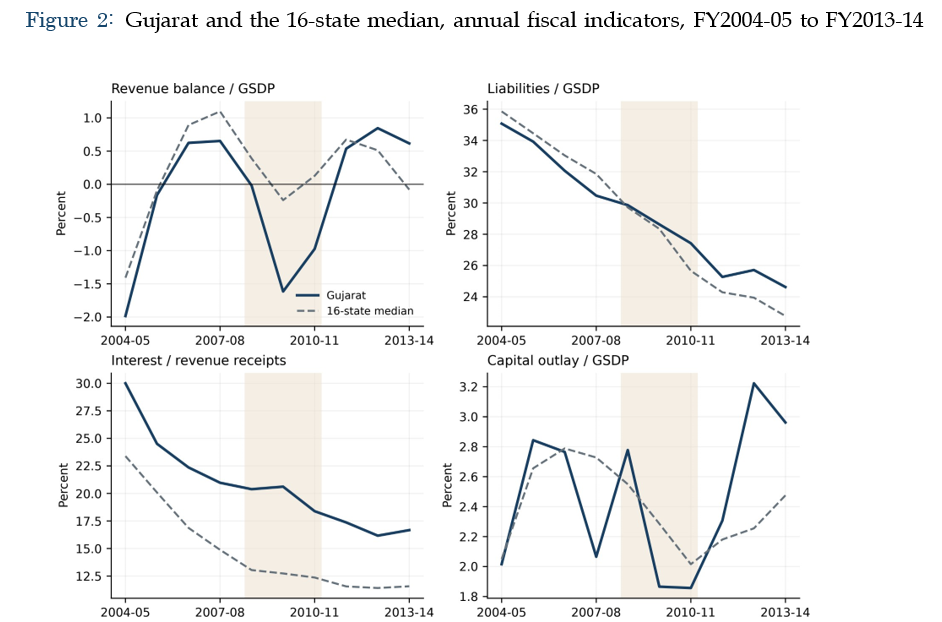
Figure 2 shows the annual path. The fiscal deficit fell below 2 percent of state output in FY2006-07 and FY2007-08, years in which the primary account was in surplus. The global financial crisis then pushed the deficit up to 3.51 percent in FY2009-10 and pulled capital outlay down to 1.87 percent, after which both recovered. Comparing single end years instead of averages would enlarge the gains to 1.87 points on the deficit and 0.95 points on capital outlay. The unusually high deficit in FY2004-05 and the year-to-year variability of capital outlay account for much of that difference, so the averaged figures are the more cautious reading. In rupees, capital outlay rose from Rs 4,100 crore to Rs 22,677 crore.
Social-sector spending increased from 4.98 to 5.47 percent of state output, although it remained below the median state. A wider capital measure that includes debt repayment and financial transactions fell from 5.21 to 3.85 percent, but because capital outlay rose over the same period, that decline did not reflect a corresponding fall in spending classified as capital outlay.
4.2 Why the primary deficit rose
The primary deficit is the only line in Table 4 that moved against the trend, rising by 0.15 points, and Table 5 accounts for the increase. The primary revenue balance, which is the revenue balance before interest, improved by 0.331 points and broadly covered the 0.289-point rise in capital outlay. The remaining items in the capital account rose by 0.193 points and explain the rest.
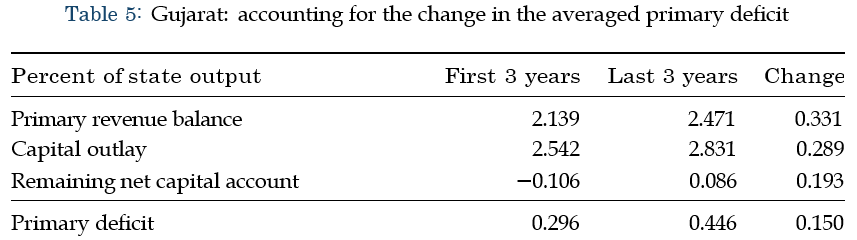
Those remaining items combine lending by the state, other non-debt capital receipts and accounting entries. Because the published data do not break them down by transaction, the table cannot show which saving financed which outlay.
4.3 Growth cut the debt ratio
Liabilities fell from 35.08 to 24.62 percent of state output even as their rupee value grew from Rs 71,334 crore to Rs 1,88,518 crore. Table 6 splits the 10.45-point fall into the four terms described in Section 2.2 and sets it alongside the Union periods discussed in Section 7.
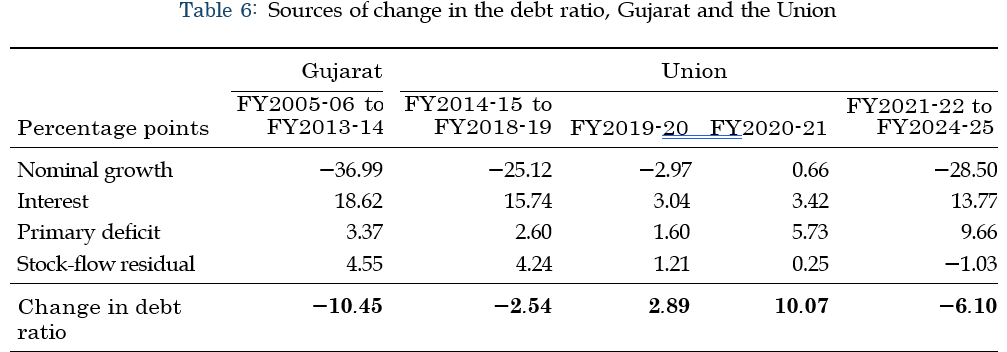
contracted in FY2020—21, so the growth term raised the ratio. Sources: authors’ calculations from [1]—[3].
Growth removed 36.99 points, while interest, primary deficits and the residual together added back 26.54. The net decline was therefore the result of growth outpacing the interest bill, achieved while the primary account remained in deficit over the period as a whole.
At 4.55 points, Gujarat’s residual is the third largest of the 16 states, which means liabilities rose by more than the reported deficits imply. Accumulated cash and financial investments can produce such a gap, as can changes in coverage or in the vintage of source data. The state’s Finance Accounts list cash balances, Treasury bill holdings and investments of earmarked funds separately.2 Assigning the residual among these causes would require year-by-year matching of assets and liabilities, which this report does not attempt.
5. Gujarat stood out on revenue, not debt
5.1 Gujarat kept pace on debt
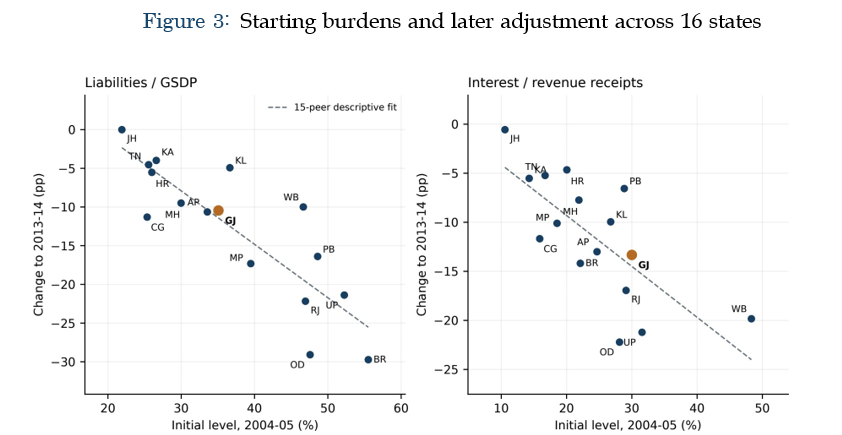
Debt ratios fell in most large states over the decade. The median state’s own decline was 10.55 points against Gujarat’s 10.45, within a range from 29.73 points in Bihar to almost no change in Jharkhand. Jharkhand was formed in 2000 and started with the smallest burden in the panel, and leaving it out shifts the median only to 10.64. A second measure, the change in the median ratio across years, shows a 13.09-point fall, which differs because the states at the centre of the distribution change from year to year. Gujarat ended the period 1.85 points above the median ratio.
On interest, Gujarat started at 30.00 percent of receipts against a median of 23.39 and finished at 16.67 against 11.57. Heavier starting burdens were generally followed by larger reductions, and Gujarat sits near the line fitted to the other fifteen states for both debt and interest (Figure 3). The size of its improvement is therefore in keeping with where it began.
5.2 Gujarat was near the top on revenue
The revenue side is where Gujarat departs from the pattern (Table 7). Its 1.17-point improvement in the revenue balance was bettered only by Jharkhand, Odisha and Uttar Pradesh, and its 1.21-point rise in own-tax revenue only by Bihar. Capital outlay rose by 0.29 points and finished above the median of 2.48 percent. All three rankings hold when Gujarat is dropped from the benchmark.
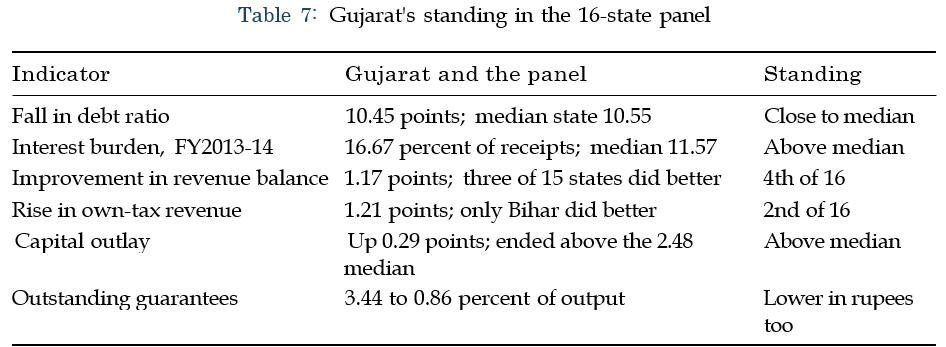
Source: authors’ state panel.
5.3 Guarantees fell in rupees too
A guarantee commits the state to pay if a public body such as a power utility cannot. Gujarat’s outstanding guarantees declined from 3.44 to 0.86 percent of state output between FY2007-08 and FY2013-14. In rupees they fell from about Rs 11,318 crore to Rs 6,549 crore, so the fall was more than a denominator effect, although the aggregate data do not show how much of it came from repayment, expiry or fewer new guarantees.
6. Power reform improved collections
6.1 Enforcement targeted the board’s losses
In FY2000-01 the Gujarat Electricity Board lost Rs 2,246 crore on revenues of Rs 6,280 crore. An account built on interviews with officials attributes the response to Modi’s appointment of Manjula Subramaniam to run the board and the energy administration. Action on large unpaid bills, disconnections and a dedicated drive against theft followed [14].
A case study based on utility records describes the wider programme, which combined inspection squads with payment counters in banks and post offices, mobile collection and field-level targets [15]. The board itself was split into separate companies in April 2005. Cash collections rose by about 43 percent between FY2003-04 and FY2006-07, to roughly Rs 13,100 crore, and transmission and distribution losses fell from 35.9 to 21.5 percent over a similar period. These are cash collections rather than recovery of arrears, and utility revenue is distinct from state tax revenue.
6.2 Negotiation and feeder separation followed
Enforcement was accompanied by negotiation. Under a February 2004 settlement with the Bharatiya Kisan Sangh, the government eased the treatment of past farm bills and scaled back a proposed tariff increase [16].
The Jyotigram scheme then separated farm feeders from village household lines so that agricultural supply could be scheduled on its own. A peer-reviewed evaluation reports steadier household power in villages, more predictable supply to farms and closer control of subsidised pumping [17]. It also records a cost borne by poorer users, as rationed farm supply shrank local groundwater markets and raised the price of water for some marginal farmers and tenants. The Ministry of Power’s July 2014 account documents Gujarat’s separate feeder arrangements [18].
6.3 The budget still supported the power companies
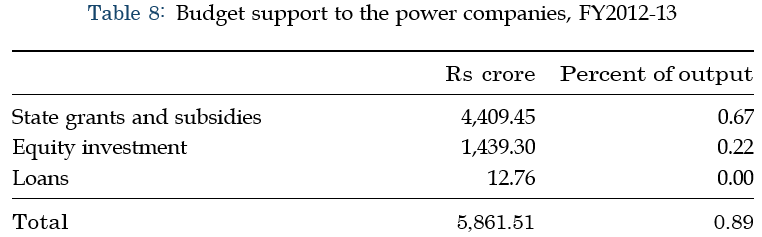
Budget support nonetheless continued. The Comptroller and Auditor General (CAG) reports outgo of about Rs 5,862 crore to the power companies in FY2012-13, equal to 0.89 percent of state output (Table 8). Guarantees of a further Rs 1,017 crore were outstanding at end-March 2013 [19]. These figures cover a single year, so they cannot establish a trend; that would need a consistent annual series of grants, subsidies, equity and loans.
6.4 Feeder separation became national policy
In November 2014 the Union Cabinet approved the Deendayal Upadhyaya Gram Jyoti Yojana, which included separate farm and non-farm feeders, stronger distribution networks and metering [20]. The instrument tested in Gujarat thus became part of a national programme under the same leadership, carrying with it differentiated supply, measured losses and an explicit subsidy.
7. The Union consolidated, reversed and recovered
7.1 Deficits fell for five years
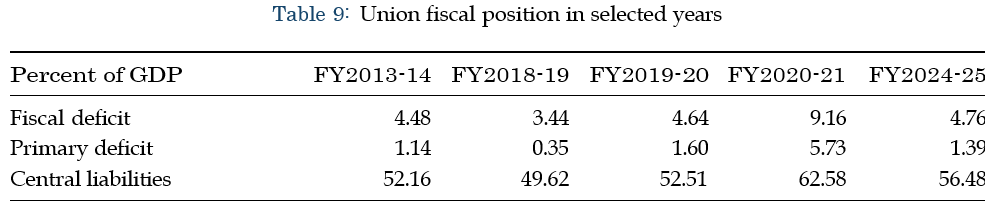
From FY2013-14 to FY2018-19 the Union fiscal deficit fell from 4.48 to 3.44 percent of GDP, the primary deficit from 1.14 to 0.35 percent and the revenue deficit from 3.18 to 2.40 percent. Over the same years central liabilities declined from 52.16 to 49.62 percent (Table 9).
Two measures did not improve over these years. Interest took 36.88 percent of Union revenue receipts in FY2013-14 and 37.52 percent in FY2018-19. The tax revenue the Centre retained after devolution also slipped, from 7.26 to 6.97 percent of GDP, although this measures the Union’s own resources rather than tax effort across the economy. As in Gujarat, growth accounted for the fall in the debt ratio (Table 6). Part of the 4.24-point residual reflects a change in coverage, since the RBI counts extra-budgetary borrowing in internal debt from FY2016-17.
7.2 The reversal came before the pandemic
FY2019-20 brought the consolidation to an end, with the fiscal deficit rising to 4.64 percent of GDP, the primary deficit to 1.60 percent and liabilities to 52.51 percent. Counting that year lifts the average fiscal deficit from FY2014-15 onward from 3.67 to 3.83 percent. In the debt arithmetic, interest of 3.04 points outweighed the growth term of −2.97 points.
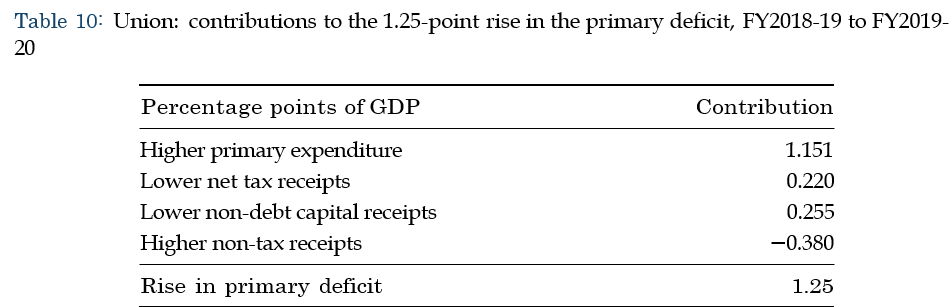
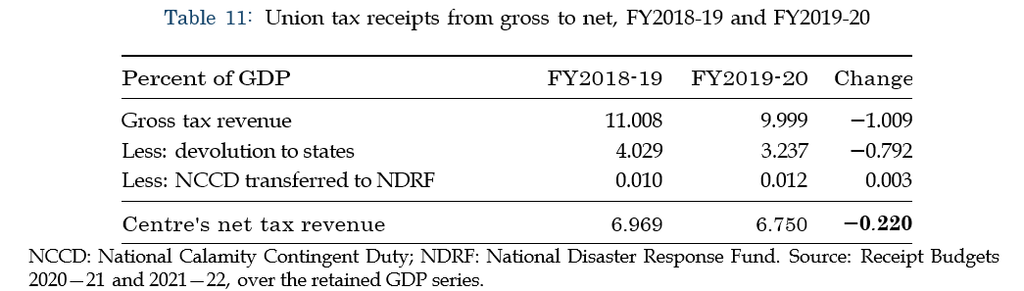
Higher primary spending was the main contributor (Table 10), but receipts weakened as well. The corporate tax reduction announced on 20 September 2019 was expected to forgo about Rs 1.45 lakh crore in gross revenue [21]. The Centre’s corporate tax after devolution fell from 2.22 to 1.69 percent of GDP, although the two figures cover different fiscal perimeters, and the slowdown and weaker non-tax items also played a part.
Lower devolution shifted much of the revenue loss on to the states. Gross Union tax revenue declined from about Rs 20.80 lakh crore to Rs 20.10 lakh crore, while devolution to states fell by more, from about Rs 7.61 lakh crore to Rs 6.51 lakh crore, a cut of about Rs 1.11 lakh crore. 3 As Table 11 shows, a one-point drop in gross tax relative to GDP therefore became a drop of only 0.22 points for the Centre.
7.3 The pandemic added ten points to debt
In FY2020-21 the fiscal deficit reached 9.16 percent of GDP and the debt ratio climbed 10.07 points to 62.58 percent. The primary deficit supplied 5.73 points of that increase, interest 3.42, falling nominal output 0.66 and the residual 0.25. The rise therefore reflected both exceptional borrowing and the effect of falling nominal output on the ratio, with the primary deficit the largest single contributor.
7.4 The recovery shifted spending towards capital
By FY2024-25 the fiscal deficit had fallen to 4.76 percent, the primary deficit to 1.39 percent and the revenue deficit to 1.71 percent, while liabilities had eased to 56.48 percent of GDP, a reduction of 6.10 points led once again by growth (Table 6).
The composition of spending changed more than the totals (Figure 4). Between FY2019-20 and FY2024-25, capital expenditure rose from 1.67 to 3.18 percent of GDP and from 12.50 to 22.61 percent of total spending. Capital outlay, which leaves out loans and advances, went from 1.55 to 2.59 percent of GDP, so the increase was not simply lending recorded as capital. The revenue deficit, meanwhile, accounted for 79.72 percent of the fiscal deficit in FY2020-21 but only 35.84 percent in FY2024-25. What this spending yields will depend on project choice, execution and upkeep, none of which appears in fiscal data.
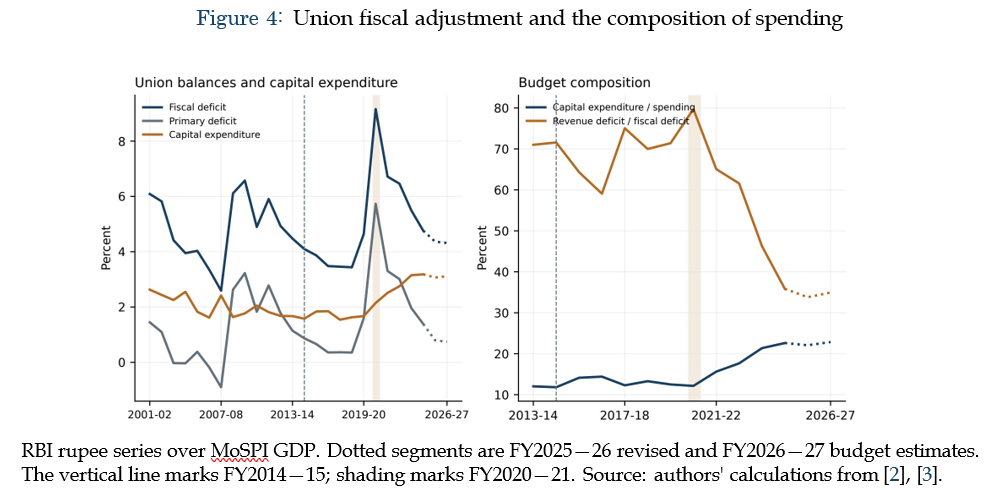
Even so, liabilities in FY2024-25 remained 3.97 points of GDP above FY2019-20 and 4.32 points above FY2013-14, and interest still absorbed 36.74 percent of revenue receipts.
7.5 Combined debt stayed higher
The combined accounts of the Centre and the states give a wider view (Figure 5). Between FY2013-14 and FY2018-19 the combined fiscal deficit fell from 6.7 to 5.8 percent of GDP. Consolidated liabilities nonetheless rose, from 67.06 to 70.53 percent, as state liabilities and inter-governmental adjustments offset the fall in central liabilities. They peaked at 89.24 percent in FY2020-21 and had eased to 82.14 percent by FY2023-24, when the combined deficit was 8.0 percent. That still left them 7.02 points above their FY2019-20 level of 75.12 percent.
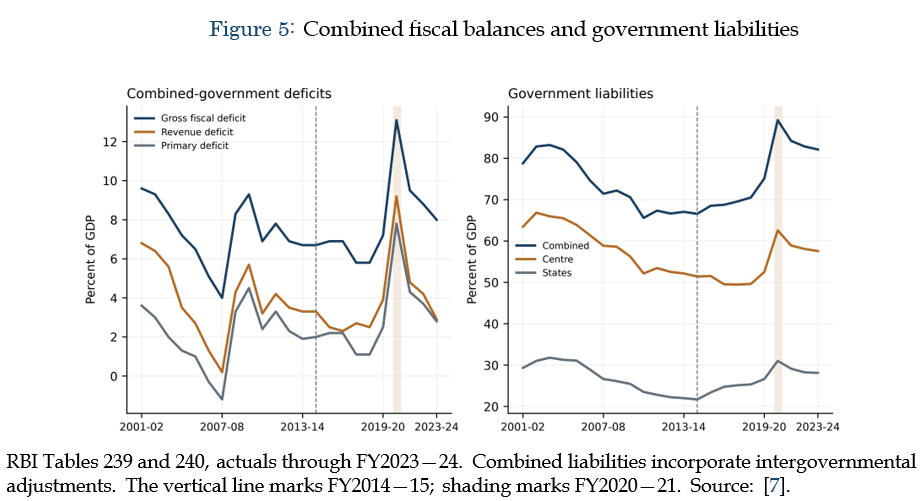
Compensation to states under the goods and services tax illustrates why the boundary between Centre and states matters. In place of compensation shortfalls, the Centre borrowed Rs 1.10 lakh crore in FY2020-21 and Rs 1.59 lakh crore in FY2021-22 and lent the money on to states and eligible Union Territories [22]. This created a Union liability matched by a claim on the states and serviced from the compensation cess [23], so national borrowing supported state spending without appearing solely in the states’ own market borrowing.
8. What the accounts include matters
Food subsidy financing, bank recapitalisation and the audit of the FY2019-20 deficit show how much the reading of the Union’s position depends on what the accounts include. Bringing obligations onto the budget improves visibility, but the underlying liabilities and their servicing costs matter either way.
8.1 One year produced two deficit figures
For FY2019-20 the CAG compared the fiscal deficit in the Budget at a Glance, about Rs 9.34 lakh crore, with the figure derived from the Union Government Finance Accounts, about Rs 10.31 lakh crore [24]. The Rs 97,475 crore gap consisted of bank capital infusion, external assistance passed to state projects and other expenses netted against receipts. The audit therefore documents a material difference between two published presentations of the deficit for the same year.
8.2 Food subsidy loans moved onto the budget
Until Budget 2021-22, the Food Corporation of India financed part of the food subsidy through loans from the National Small Savings Fund, which kept those subsidy obligations outside the immediate budget appropriation. That budget ended the practice and moved the cost onto the budget, with loans of about Rs 2.55 lakh crore outstanding at end-March 2020 [25]. The change raised recorded spending during the transition. The outstanding stock is not the same as the effect on any one year’s deficit; measuring that would need annual data on disbursements, repayments and accrued claims.
8.3 Recapitalization bonds kept capital below the line
From 2017, public sector banks were recapitalised with government bonds recorded below the line as financial transactions, so the capital itself did not enter the deficit. The interest on the bonds did, rising from about Rs 5,800 crore in FY2018-19 to Rs 16,286 crore in FY2019-20 and Rs 19,293 crore in FY2020-21 on revised estimates [26]. At end-March 2025, about Rs 2.68 lakh crore of these securities were outstanding as gross liabilities held against equity in the banks [27]. Over a similar period, gross bad loans of all scheduled commercial banks fell from 11.2 percent of advances to 2.2 percent [7], a figure that also covers private banks and reflects write-offs and new lending.
8.4 The debt target moved
The 2018 amendment to the Fiscal Responsibility and Budget Management (FRBM) Act fixed central debt at 40 percent of GDP by end-March 2025 [28]. The operational path now aims for 50 ± 1 percent by FY2030-31 [29], and the fiscal statement continues to print the statutory target alongside the shortfall against it (Table 12).
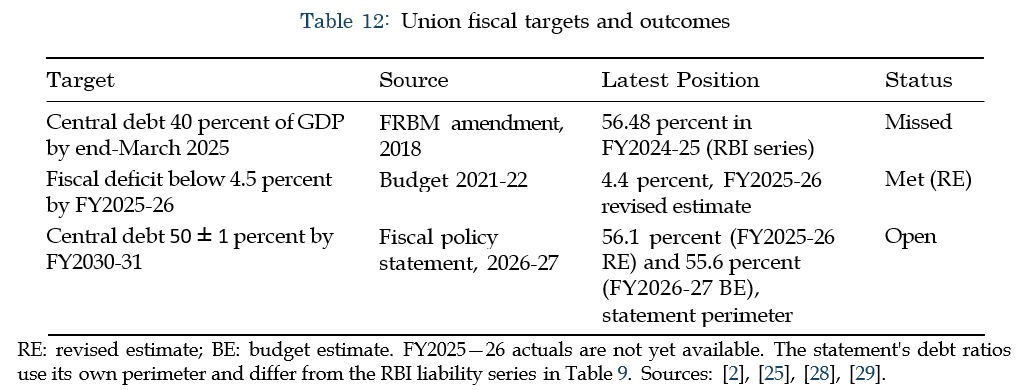
The pandemic accounts for much of the distance between the statutory target and the new path, although the deficit had already started rising in FY2019-20. Future assessments will measure execution against the revised path.
9. Conclusion
The two records share a leader, but the adjustment took different forms in each. The comparisons describe outcomes and cannot isolate the effect of that leadership. During Narendra Modi’s tenure as Chief Minister, Gujarat moved its revenue account into surplus and lifted its own taxes faster than all but one of the other large states. It also cut the share of receipts lost to interest, increased capital outlay and reduced its guarantees, even though its debt ratio fell no faster than the typical state’s and its power companies continued to draw on the budget.
The Union record followed a different sequence. Consolidation through FY2018-19 gave way to a reversal in FY2019-20 and then a pandemic that added ten points to the debt ratio. The adjustment that followed reduced the fiscal, primary and revenue deficits and shifted spending towards capital, and the revised estimate for FY2025-26 meets the Budget 2021-22 commitment to a deficit below 4.5 percent of GDP. Central liabilities nevertheless remain above their FY2019-20 and FY2013-14 levels, interest still absorbs about 37 percent of revenue receipts, and the original statutory debt target was missed.
Deficit and debt ratios alone do not capture these differences in structure. Gujarat’s record is distinguished by stronger recurring fiscal capacity, as receipts grew much faster than the interest bill, while the Union’s post-pandemic adjustment combines deficit reduction with a shift of spending towards capital. FY2019-20 showed how quickly growth-supported debt reduction can turn when growth weakens and primary borrowing rises.
References
- Reserve Bank of India, “Handbook of statistics on indian states 2024—25,” Reserve Bank of India, Tech. Rep., 2025, 11 December. Tables 164 (gross fiscal deficit), 167 (primary deficit) and 174 (capital outlay). [Online]. Available: https: //rbi. org. in/scripts/PublicationsViev. aspx?id=23613.
- Reserve Bank of India, “Handbook of statistics on the indian economy 2025—26,” Reserve Bank of India, Tech. Rep., 2026, 31 July. Tables 86, 87, 89 and 104; rupee series. [Online]. Available: https: //vvv. rbi. org. in/Scripts/PublicationsViev. aspx?id=23911.
- Ministry of Statistics and Programme Implementation, National accounts statistics: Annual GDP, £011-1£ base, back and current series, Oficial data API, NAS dataset, indicator 5, Revision status retained by observation, 2026. [Online]. Available: https: //esankhyiki. nospi. gov. in/nacroindicators?product=nas (visited on 09/06/2026).
- V. Shekhar, InĄation outcomes across indian prime ministers: A comparatiue analysis, 19j7-£0£5, SSRN Working Paper 6074751, 2026.
- Reserve Bank of India, “Handbook of statistics on state government finances,” Reserve Bank of India, Tech.Rep., 2004.
- Reserve Bank of India, Handbook of statistics on indian states: Selected state-/nance and electricity tables.
- Reserve Bank of India, Handbook ofstatistics on the indian economy: Selected /scal, debt and banking tables, Tables 50, 232, 239 and 240. Extracts have diflerent terminal coverage; estimate labels and definitions are retained as printed.
- H. R. Davoodi, P. Elger, A. Fotiou, et al., “Fiscal rules and fiscal councils: Recent trends and performance during the COVID-19 pandemic,” International Monetary Fund, IMF Working Paper 2022/011, 2022. DOI: 10. 5089/9798400200472. 001.
- H. Bohn, “The behavior of U. S. public debt and deficits,” the Quarterly Journal of Economics, vol. 113, no. 3, pp. 949—963, 1998. DOI: 10. 1162/003355398555793.
- Reserve Bank of India, “Annual report 2002—03: Public debt management,” Reserve Bank of India, Tech. Rep., 2003, Chapter XI, paragraphs 11. 33—11. 36. [Online]. Available: https: //rbi. org. in/scripts/Annual ReportPublications. aspx?Id=345.
- Indian Economic Service, Debt consolidation and relief facility (DCRË), Arthapedia, Ministry of Finance. [Online]. Available: https: //ies. gov. in/arthapedia/concept/debt- consolidation- and- relief-facilit y-dcrf (visited on 09/06/2026).
- Comptroller and Auditor General of India, “Report of 2014: Financial audit on state finance of government of Gujarat,” Comptroller and Auditor General of India, Tech. Rep., 2014, Accounts for the year ended March 2013. [Online]. Available: https: //saiindia. gov. in/en/audit- report/details/628.
- Finance Department, Government of Gujarat, “Statements under the Gujarat fiscal responsibility act, 2005: Year 2006—07,” Government of Gujarat, Tech. Rep., 2006, Laid in the Legislative Assembly, March 2006. Medium-term fiscal policy statement recording the introduction of VAT from 1 April 2006. [Online]. Available: https: //financedepartnent. guj arat. gov. in/Docunents/Rule- Eng_26_2014-9-23_811. pdf.
- N. Madhavan, “Gujarat’s power sector turnaround story,” Business today, 2012, 31 January online; 5 Febru-ary print edition. [Online]. Available: https: //vvv. businesstoday. in/nagazine/case-study/story/guj ar ats-pover-sector-turnaround- story- 28831-2012-01-31.
- R. M. Joshi, “Gujarat electricity board’s turnaround: Complete rural electrification in gujarat,” Indian Insti-tute of Foreign Trade, Case study CS-08-025, 2008, 21 October version; utility data attributed to GUVNL. [Online]. Available: https: //vvv. acadenia. edu/819255/Guj arat_Electricity_Board_s_Turnaround.
- R. J. Shah, “Modi gives sops to farmers in run up to polls,” the times of India, 2004, 3 February. [Online]. Available: https: //tinesofindia. indiatines. con/city/ahnedabad/nodi- gives- sops- to- farners- in- r un- up-to polls/articleshov/472750. cns.
- T. Shah, S. Bhatt, R. K. Shah, and J. Talati, “Groundwater governance through electricity supply man-agement: Assessing an innovative intervention in gujarat, western india,” Agricultural Water Management, vol. 95, pp. 1233—1242, 2008. DOI: 10. 1016/j . agvat. 2008. 04. 006.
- Ministry of Power, Uninterrupted supply of electricity, Press Information Bureau, 17 July, Lok Sabha written reply, 2014. [Online]. Available: https: //vvv. pib. gov. in/nevsite/PrintRelease. aspx?relid=106870.
- Comptroller and Auditor General of India, “Report on public sector undertakings, government of Gujarat, for the year ended march 2013,” Comptroller and Auditor General of India, Report 3 of 2014, 2014, Section 1. 10, pp. 4—5, and Annexure 3, pp. 85—86; figures furnished by PSUs. [Online]. Available: https: //cag. gov. in/ag2/guj arat/en/audit- report/details/5572.
- Cabinet, Government of India, Deendayal upadhyaya gram Jyoti yoJana, Press Information Bureau, 20 Novem-ber, Cabinet approval of programme components, 2014. [Online]. Available: https: //vvv. pib. gov. in/nevs ite/erelcontent. aspx?relid=111626.
- Ministry of Finance, Corporate tax rates slashed to ££F for domestic companies and 15F for new domestic manufacturing companies and other /scale reliefs, Press Information Bureau, 20 September, 2019. [Online]. Available: https: //vvv. pib. gov. in/PressReleasePage. aspx?PRID=1585641.
- Ministry of Finance, Status note on GSt compensation released to States/Uts, Press Information Bureau, 27 April, 2022. [Online]. Available: https: //vvv. pib. gov. in/PressReleasePage. aspx?PRID=1820749.
- S. Mukherjee, “Revenue shortfall and GST compensation: An assessment,” National Institute of Public Finance and Policy, Working Paper 356, 2021. [Online]. Available: https: //vvv. nipfp. org. in/nedia/nedi alibrary/2021/10/WP_356_2021. pdf.
- Comptroller and Auditor General of India, “Compliance of the fiscal responsibility and budget management act, 2003, for the year 2019—20,” Comptroller and Auditor General of India, Report 18 of 2022, 2022, Section 3. 4. 1, pp. 9—10. [Online]. Available: https: //cag. gov. in/uploads/nedia/Report- No-18-of-2022-FRBH-20 19-20-064cb72358694e4-18247180. pdf.
- Ministry of Finance, “Union budget 2021—22: Budget speech,” Government of India, Tech. Rep., 2021, Para-graphs 141 and 143, and Annexure VI. [Online]. Available: https: //vvv. indiabudget. gov. in/budget2021-22/doc/Budget_Speech. pdf.
- I. Padhi, S. Sood, R. Agarwal, et al., “Union budget 2021—22: An assessment,” RBI Bulletin, 2021, 19 March; section on bank recapitalisation and Table 6. [Online]. Available: https: //rbi. org. in/scripts/BS_VievBu lletin. aspx?Id=20142.
- Ministry of Finance, “Union budget 2026—27: Receipt budget,” Government of India, Tech. Rep., 2026, An-nexure 2J, pp. 66—70: special securities issued to public-sector banks for recapitalisation. [Online]. Available: https: //vvv. indiabudget. gov. in/doc/rec/allrec. pdf.
- Comptroller and Auditor General of India, “Compliance of the fiscal responsibility and budget management act, 2003, for the year 2018—19,” Comptroller and Auditor General of India, Report 6 of 2021, 2021, Chapter 3. [Online]. Available: https: //cag. gov. in/uploads/dovnload_audit_report/2021/07_Chapter,203- 061a 4c47f708b11. 23974105. pdf.Ministry of Finance, “Union budget 2026—27: Statements of fiscal policy as required under the FRBM act, 2003,” Government of India, Tech. Rep., 2026, Medium-term fiscal policy cum fiscal policy strategy statement. [Online]. Available: https: //vvv. indiabudget. gov. in/doc/frbn1. pdf.