

FY 2025-26 | Annual Report
EXECUTIVE SNAPSHOT
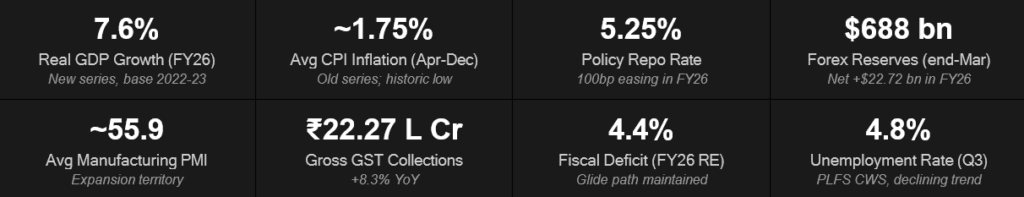
The Indian economy is estimated to have grown by 7.6 per cent in real terms during FY2025–26, supported by broad-based momentum in manufacturing and services alongside record agricultural output. High-frequency indicators point to continued formalisation in economic activity, reflected in digital transactions, tax collections, and goods movement. Fiscal consolidation remained on track, with the deficit held at the revised target of 4.4 per cent of GDP, and the sovereign secured a rating upgrade from S&P.
At the same time, emerging pressures in the financial and external sectors warrant close policy attention. Credit growth outpaced deposit mobilisation through the year, pushing the system-wide credit-to-deposit ratio to 83.04 per cent. India’s external sector faced significant stress in the final quarter following the escalation in West Asia, which triggered foreign portfolio equity outflows and an 9.88 per cent depreciation of the rupee. While a structural services export surplus contained the current account deficit, the moderation in industrial sentiment and a firming inflation trajectory suggest that sustaining non-inflationary growth into FY27 will require continued vigilance.
1. GLOBAL MACROECONOMIC CONTEXT
KEY METRICS AT A GLANCE
MACRO ANALYSIS
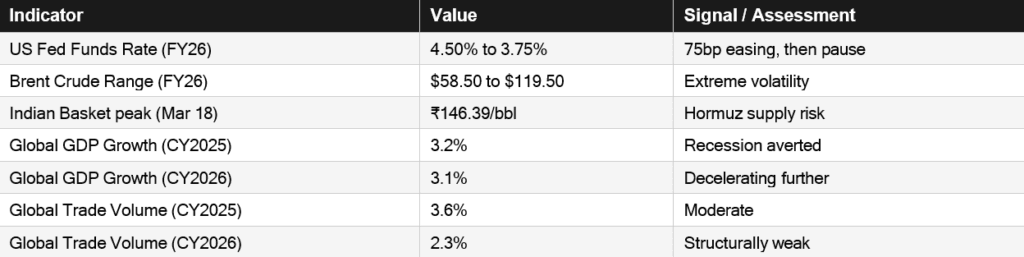
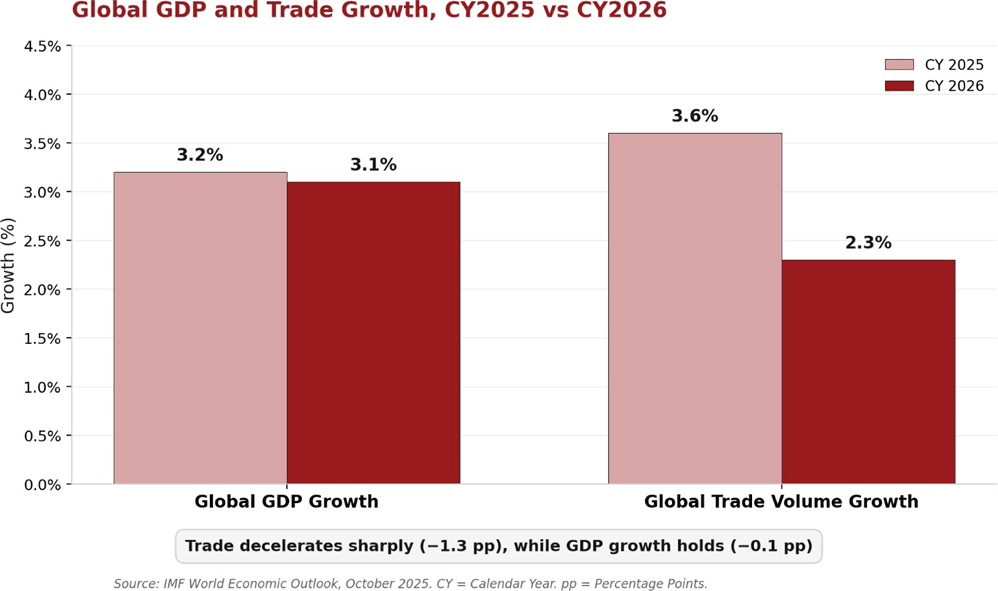
The global economy grew at 3.2 per cent in CY2025 and is projected to decelerate modestly to 3.1 per cent in CY2026, a pace sufficient to avert recession but inadequate to generate meaningful trade tailwinds for emerging markets. The US Federal Reserve eased monetary policy by 75 basis points during FY26, bringing the federal funds rate to 3.75 per cent. However, global trade volume growth, projected at 3.6 per cent for CY2025, is expected to slow sharply to 2.3 per cent in CY2026, reflecting tariff fragmentation and supply-chain disruption. This deceleration in trade structurally constrains export-driven growth channels for economies such as India.
Energy markets introduced a further layer of uncertainty. Brent crude oil prices ranged between $58.50 and $119.50 per barrel during the year, with prices remaining elevated near $118 per barrel at end-March. The Indian crude basket peaked at ₹146.39 per barrel on March 18 following the escalation in the Strait of Hormuz region. For India, the implication is twofold: imported inflation risk rises directly with crude prices, and the current account faces additional pressure at a time when global capital flows are already volatile. The trajectory of energy prices in the coming quarters will be a key variable shaping both monetary and fiscal policy space.
2. GDP & GROWTH BASELINE
KEY METRICS AT A GLANCE
MACRO ANALYSIS
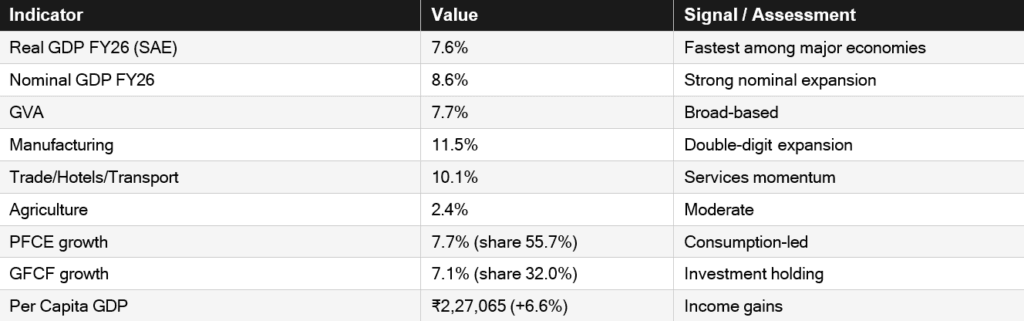
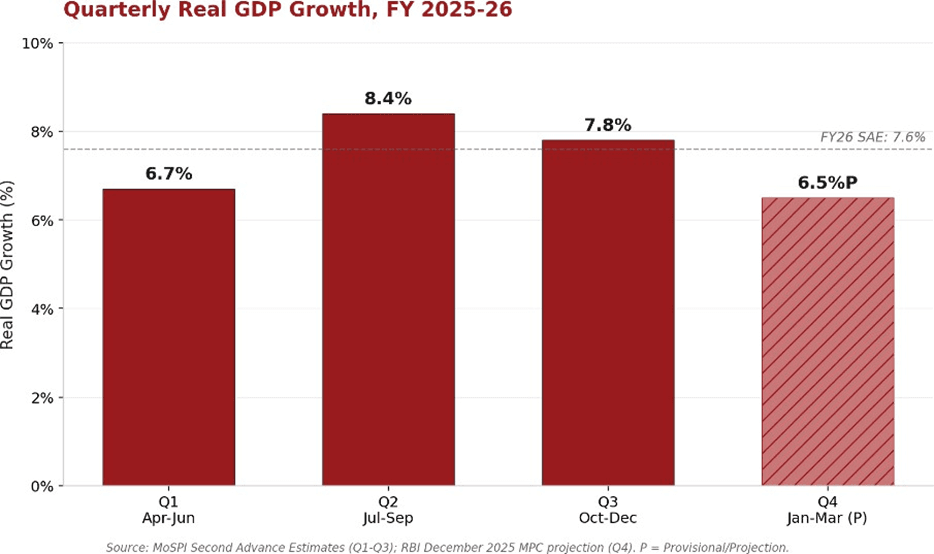
The Indian economy demonstrated exceptional resilience, recording a robust real GDP growth of 7.6% and a strong nominal expansion of 8.6% for FY26. This performance was primarily anchored by a buoyant supply side, where Gross Value Added grew at 7.7%, led by double-digit expansion in the manufacturing sector at 11.5% and a strong 10.1% growth in trade, hotels, and transport services. This formidable industrial and services momentum successfully decoupled India from the broader global economic sluggishness.
On the demand side, Private Final Consumption Expenditure grew by 7.7 per cent, maintaining a 55.7 per cent share of GDP, while Gross Fixed Capital Formation expanded by 7.1 per cent to hold a 32.0 per cent share. Per capita GDP rose 6.6 per cent to ₹2,27,065. The parallel expansion of consumption and investment suggests a maturing demand structure, though it should be noted that these are Second Advance Estimates released on February 27, 2026, and Q4 provisional data (due May 29) will determine whether the full-year outturn holds at this level. The quarterly trajectory, with growth moderating from 8.4 per cent in Q2 to 7.8 per cent in Q3, indicates that the pace of expansion was already easing before the late-March external shock.
3. INDUSTRIAL MOMENTUM & PRODUCER SENTIMENT
KEY METRICS AT A GLANCE
MACRO ANALYSIS
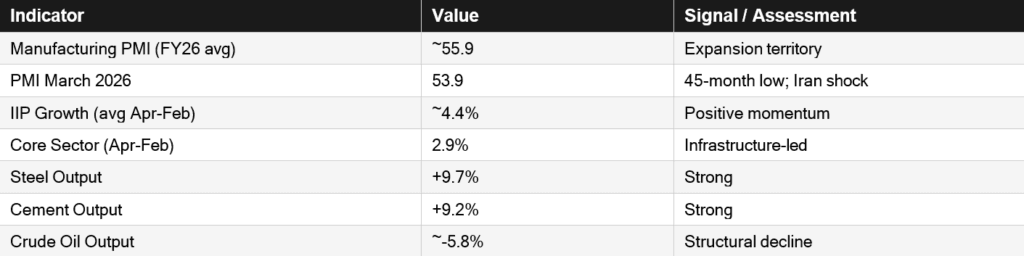
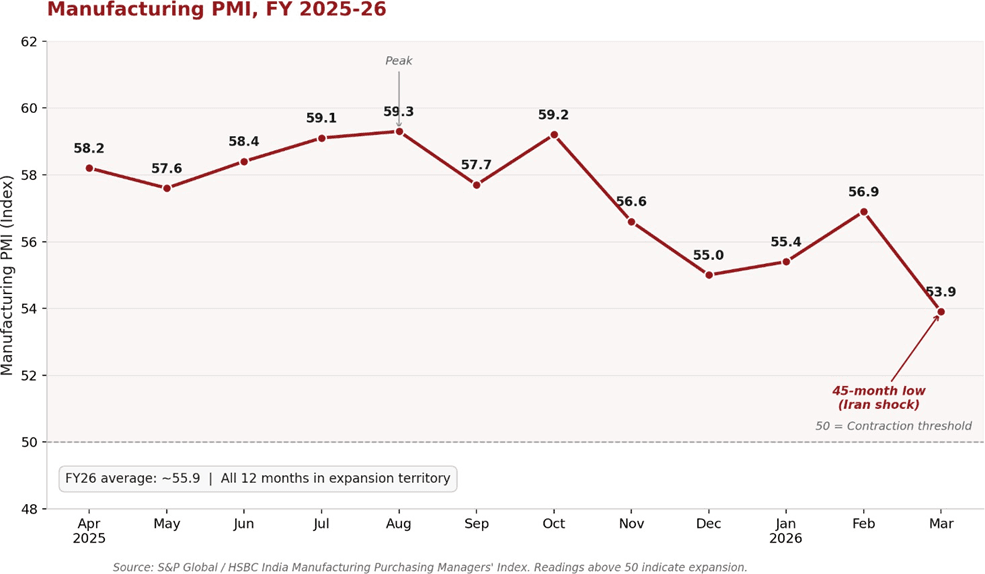
Industrial activity exhibited strong baseline momentum throughout most of the fiscal year before encountering late-cycle headwinds. The Manufacturing PMI averaged a robust 55.9, while the Index of Industrial Production maintained an average growth of 4.4%. This expansion was heavily supported by the government’s infrastructure push, which directly catalysed core sector outputs like steel and cement, growing at 9.7% and 9.2% respectively. These core metrics perfectly align with the strong fixed capital formation trends observed in the broader GDP estimates.
However, the industrial trajectory showed signs of stress towards the fiscal year-end. The PMI moderated to a 45-month low of 53.9 in March 2026, reflecting the immediate impact of the Hormuz disruption on supply chains and input costs. At the same time, the domestic energy sector continued to contract structurally, with crude oil output declining by approximately 5.8 per cent and natural gas recording its 19th consecutive month of negative growth. This persistent dependence on imported energy amplifies India’s vulnerability to precisely the type of external commodity shock that materialised in the final quarter. Nonetheless, both PMI and IIP remained in expansionary territory throughout the year, indicating that the underlying industrial base retains sufficient depth to absorb near-term pressures.
4. FORMALISATION & HIGH-FREQUENCY INDICATORS
KEY METRICS AT A GLANCE
MACRO ANALYSIS
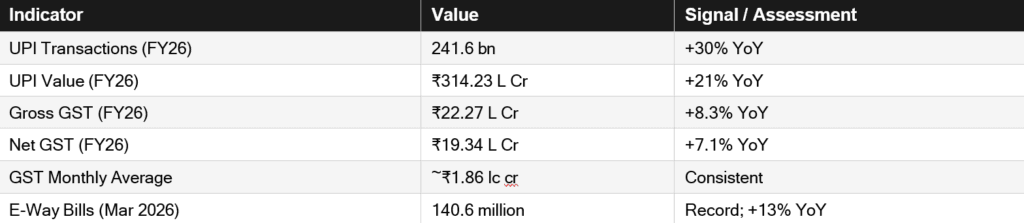
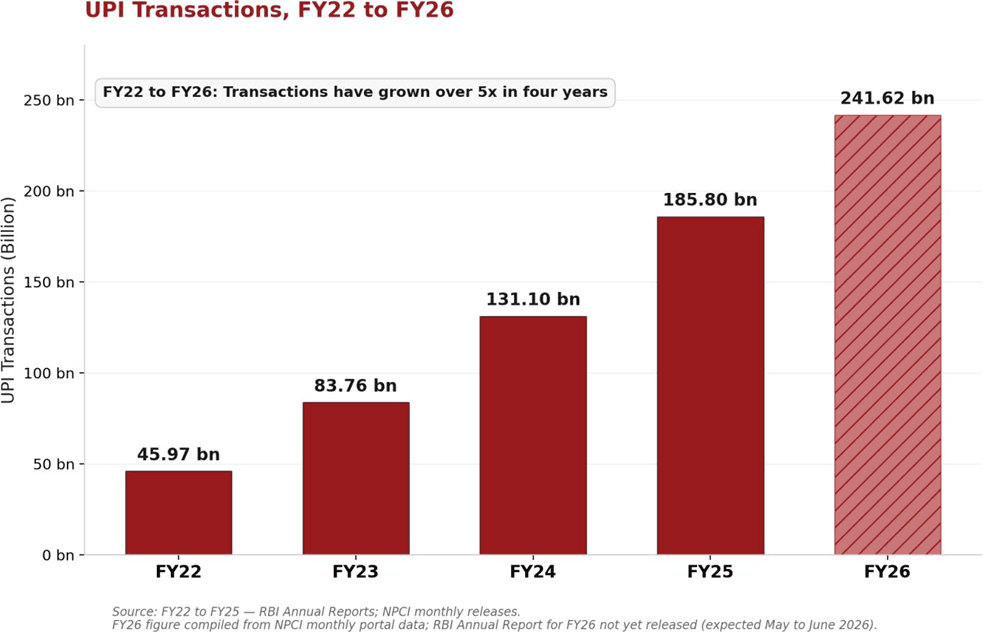
High-frequency transactional data points to a continued deepening of formalisation in the Indian economy. UPI transaction values grew 21 per cent year-on-year to ₹314.23 lakh crore across 241.6 billion transactions, while gross GST collections rose 8.3 per cent to ₹22.27 lakh crore for the fiscal year. E-way bill generation reached a record 140.6 million in March 2026, a 13 per cent increase over the previous year. Together, these indicators suggest that the underlying commercial velocity of the economy remained strong even as headline sentiment moderated.
A key feature of the year was the moderation in GST growth relative to prior years. Gross collections grew at 8.3 per cent, the slowest pace since the post-pandemic recovery. This partly reflects the mechanical impact of the rate rationalisation implemented in September 2025, which reduced levies on approximately 375 items. The resulting compression in H2 collections was a deliberate policy trade-off: lower rates in exchange for broader compliance and reduced consumer prices. The medium-term fiscal implication will depend on whether the rationalised rate structure generates sufficient volume-driven buoyancy to compensate for the per-unit revenue reduction.
5. INFLATIONARY DYNAMICS
KEY METRICS AT A GLANCE
MACRO ANALYSIS
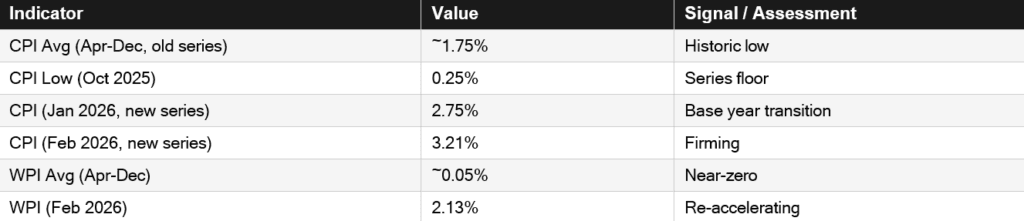
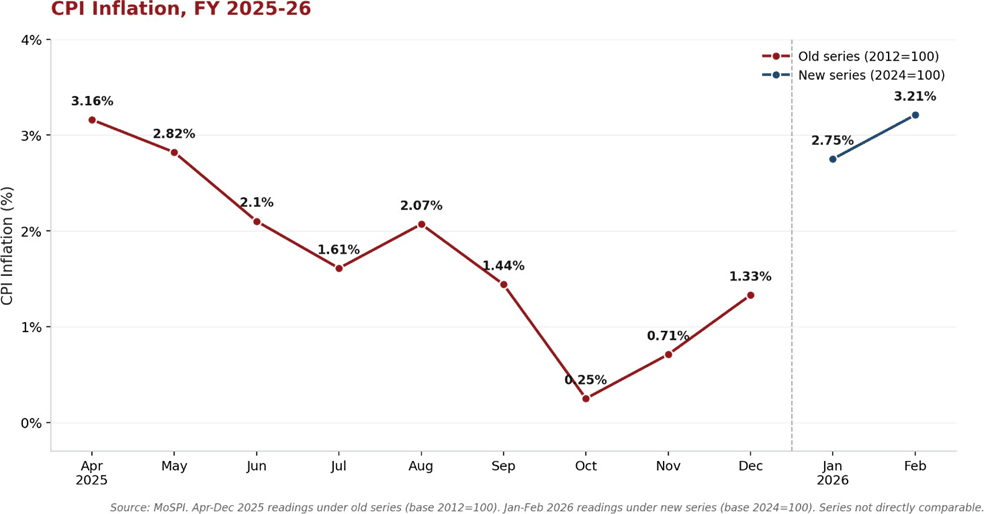
The domestic price environment experienced remarkable moderation for the majority of the fiscal year, providing critical relief to household purchasing power. Under the old base series, headline retail inflation averaged a highly benign 1.75% between April and December, bottoming out at a series low of 0.25% in October. This sustained period of disinflation was instrumental in creating the necessary macroeconomic space for the central bank to transition into an accommodative monetary easing cycle.
However, the inflation trajectory requires careful pre-emptive monitoring as the fiscal year concludes. Wholesale prices transitioned from deep deflation in mid-year to a re-acceleration, reaching 2.13% by February 2026. Concurrently, the implementation of the new CPI series with a reduced food weight of 36.75% debuted with retail inflation printing at 3.21% in February. This firming of price pressures, coupled with the late-year spike in global crude oil costs, poses a latent risk of pass-through into core manufactured goods inflation.
* CPI readings from January 2026 onward reflect the new Consumer Price Index series (Base Year: 2024=100), which incorporates a broadened consumption basket of 358 items (previously 299), a reduced food and beverages weight of 36.75% (previously 45.86%), and expanded geographic coverage including e-commerce price collection. The April to December 2025 readings reported under the prior Base Year 2012=100 series are not directly comparable to the new series.
6. FINANCIAL INTERMEDIATION
KEY METRICS AT A GLANCE
MACRO ANALYSIS
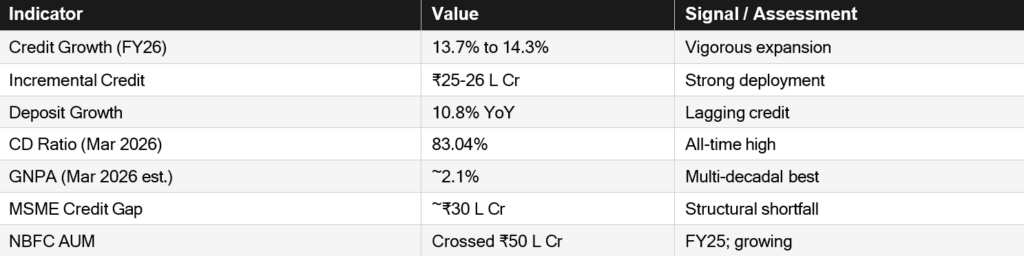
The banking sector facilitated a vigorous and optimistic phase of credit expansion, signalling strong corporate and retail confidence. Overall bank credit grew between 13.7% and 14.3%, driving an incremental credit creation of up to ₹26 lakh crore. Importantly, this lending boom occurred alongside a multi-decadal improvement in banking health, with gross non-performing assets dropping to approximately 2.1% by the end of March 2026.
Conversely, a structural asymmetry emerged as deposit mobilisation, growing at only 10.8%, failed to keep pace with the aggressive credit disbursement. This mismatch pushed the system-wide credit-to-deposit ratio to a historical peak of 83.04%, creating a persistent systemic liquidity strain. Furthermore, while NBFC assets crossed the ₹50 lakh crore threshold, a massive ₹30 lakh crore credit gap remains in the MSME sector, indicating that financial deepening has yet to reach the smallest commercial enterprises.
7. MONETARY POLICY & YIELD CURVE MANAGEMENT
KEY METRICS AT A GLANCE
MACRO ANALYSIS
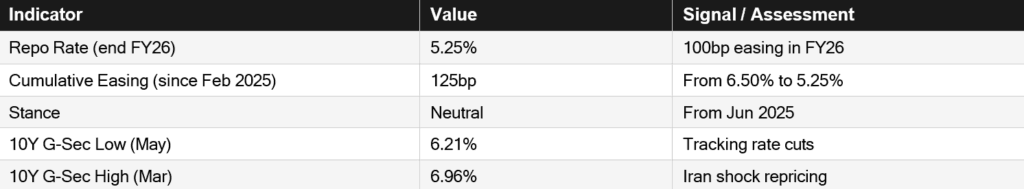
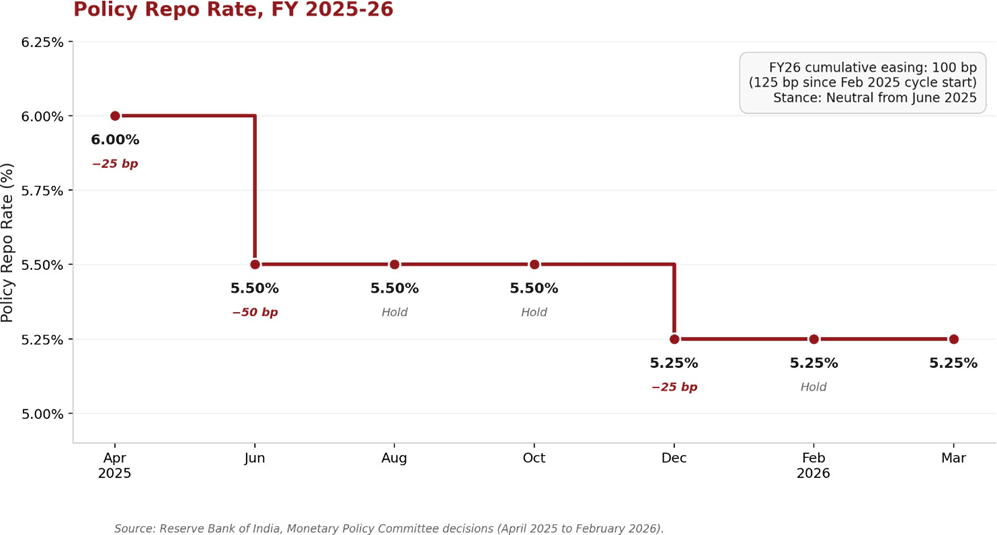
Capitalising on the benign retail inflation environment, the Reserve Bank of India executed a decisive easing cycle to support domestic growth impulses. The central bank implemented a cumulative 100 basis point reduction within FY26, as part of a broader 125 basis point easing cycle initiated in February 2025, bringing the repo rate from 6.50% to 5.25%, while maintaining a neutral stance. Massive open market operations absorbing nearly half of the Centre’s gross sovereign borrowing were conducted to ensure orderly market liquidity.
Despite these sophisticated central bank interventions, the debt markets exhibited notable stress by the fiscal year-end. The 10-year government security yield, which had softened to 6.21% in May, experienced a sharp upward correction to reach 6.96% in March 2026. This sudden yield curve steepening reflects immediate market pricing of external vulnerabilities, specifically reacting to heavy foreign portfolio outflows and the sharp depreciation of the domestic currency in the final quarter.
8. EXTERNAL SECTOR RESILIENCE
KEY METRICS AT A GLANCE
MACRO ANALYSIS
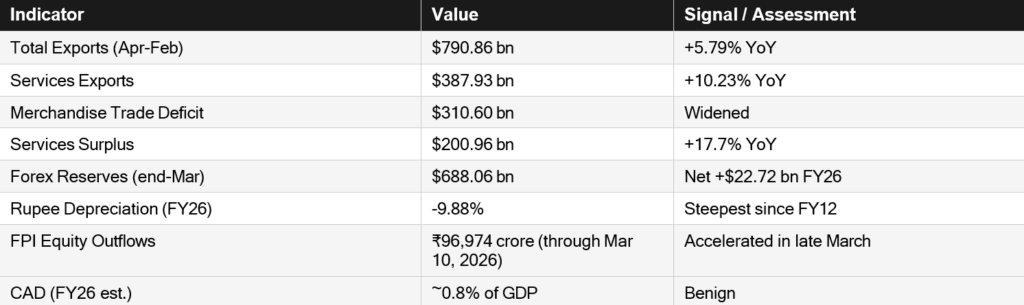
India’s external sector experienced significant stress in the final quarter of FY26 following the escalation in West Asia. Foreign portfolio equity outflows totaled ₹96,974 crore through March 10, 2026, with further acceleration in the final three weeks of the fiscal year. The rupee depreciated 11 per cent across FY26, the steepest annual decline since FY12, reaching a record low against the dollar in late March. Foreign exchange reserves, which had peaked at $728.5 billion on February 27, declined by $30.5 billion in March as the RBI intervened to smooth the depreciation, closing the fiscal year at $688.06 billion.
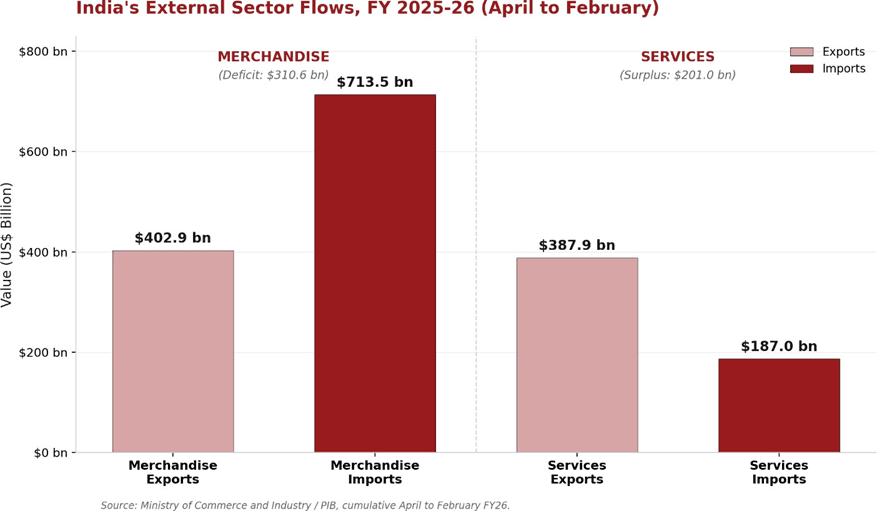
The current account, however, demonstrated structural resilience. While the merchandise trade deficit widened to $310.60 billion over April to February, it was substantially offset by a services trade surplus of $200.96 billion, which grew 17.7 per cent year-on-year. Services exports at $387.93 billion now nearly equal merchandise exports at $402.93 billion, a structural shift that fundamentally alters the character of India’s external account compared to even five years ago. The current account deficit is estimated at a contained 0.8 per cent of GDP, and import cover remains at approximately 11 months. The near-term outlook for the external sector will depend on the duration of the energy price shock and the pace at which portfolio flows stabilise.
* FPI outflow data through March 10,2026 sourced from Ministry of Finance written reply to Rajya Sabha. Official year-wise FPI data for FY2025-26 has not yet been published by NSDL
9. FISCAL POSITION & DEFICIT TRAJECTORY
KEY METRICS AT A GLANCE
MACRO ANALYSIS
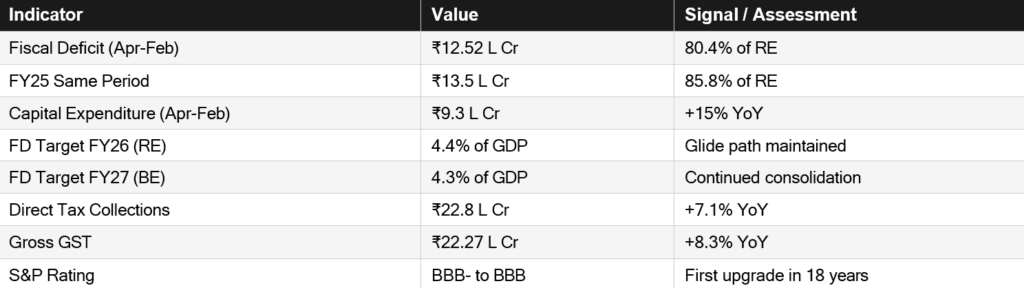
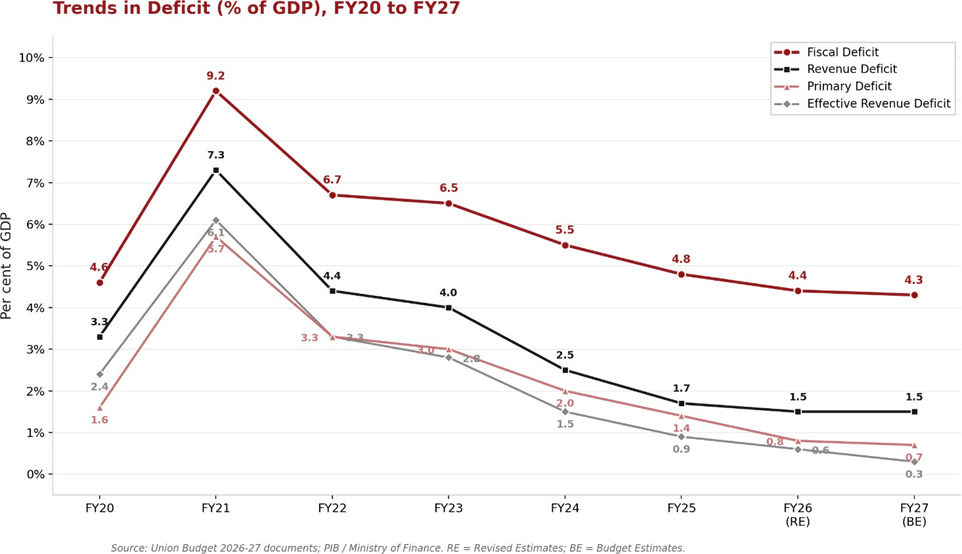
The Centre’s fiscal deficit stood at ₹12.52 lakh crore through February 2026, utilising 80.4 per cent of the revised estimate, a meaningful improvement over the 85.8 per cent recorded in the corresponding period of FY25. Capital expenditure grew 15 per cent year-on-year to reach ₹9.3 lakh crore, indicating that the consolidation was achieved without compressing the productive component of government spending. Tax buoyancy held through the year, with direct tax collections growing 7.1 per cent to ₹22.8 lakh crore and gross GST collections expanding 8.3 per cent. S&P upgraded India’s sovereign rating from BBB- to BBB during the year, the first upgrade in nearly two decades.
The fiscal glide path targets 4.4 per cent of GDP for FY26 and 4.3 per cent for FY27. Whether these targets are met will depend in part on the fiscal response to elevated crude prices. The government’s excise duty reduction on petroleum products provides immediate consumer relief but has revenue implications that will need to be managed against subsidy obligations for fertiliser and LPG. Full-year CGA provisional accounts, expected on May 30, will determine whether FY26 closes at 4.4 per cent or records a marginal slippage following the nominal GDP base year revision. The broader fiscal trajectory, however, remains one of the more credible consolidation efforts among peer emerging markets.
10. AGRICULTURAL PERFORMANCE & RURAL TERMS OF TRADE
KEY METRICS AT A GLANCE
MACRO ANALYSIS
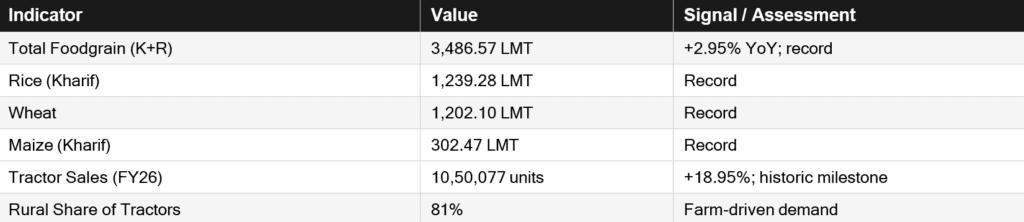
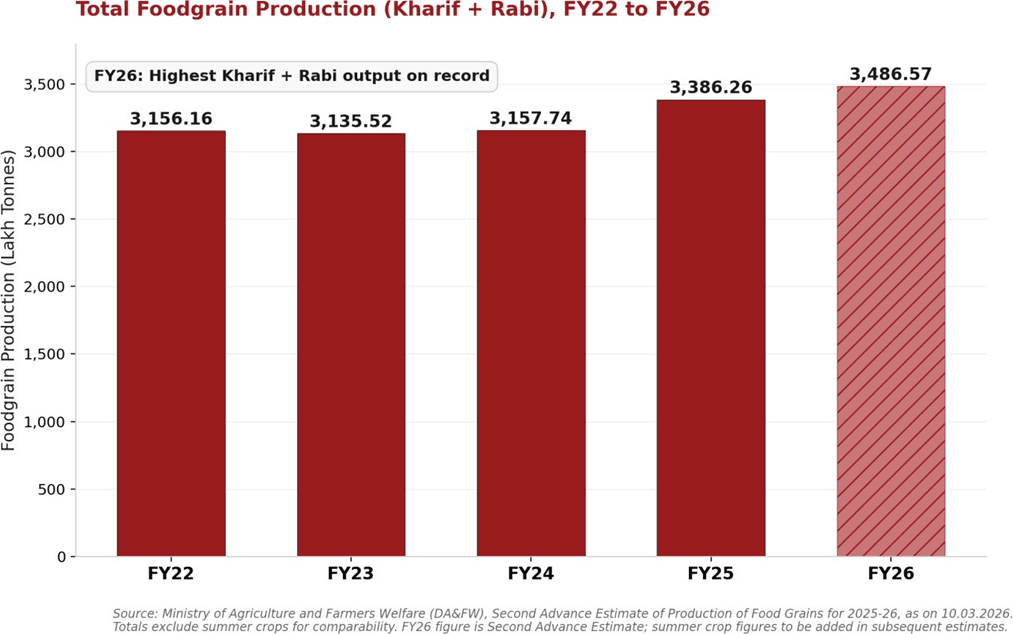
Total foodgrain production for FY26 is estimated at 3,486.57 lakh metric tonnes (Kharif and Rabi, excluding summer crops), an increase of approximately 100 LMT or 2.95 per cent over the corresponding period of FY25. Individual crop records were set in rice, wheat, maize, rapeseed and mustard, and sugarcane. This broad-based output performance, supported by a monsoon at 108 per cent of the long-period average, was the single most important factor behind the food price moderation documented in Section 5. The agriculture GVA headline of 2.4 per cent understates the sector’s macroeconomic contribution, which operated primarily through the price channel rather than the output growth channel.
Rural capital formation indicators suggest that farm incomes improved despite low wholesale food prices. Tractor retail sales crossed 10 lakh units for the first time with 18.95 per cent growth, and 81 per cent of sales originating from rural registrations. This indicates that higher production volumes compensated for softer per-unit realisations, sustaining farm household purchasing power. The sustainability of this rural momentum into FY27 will depend on the monsoon outcome, the management of agricultural input costs, particularly fertiliser and diesel, and the trajectory of global food commodity prices.
11. LABOUR MARKET DYNAMICS & EMPLOYMENT INDICATORS
KEY METRICS AT A GLANCE
MACRO ANALYSIS
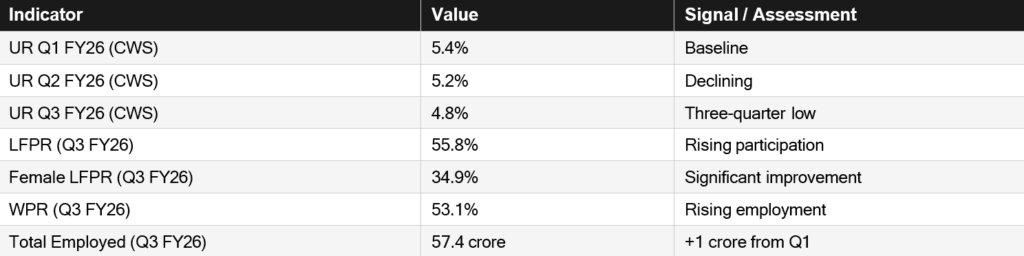
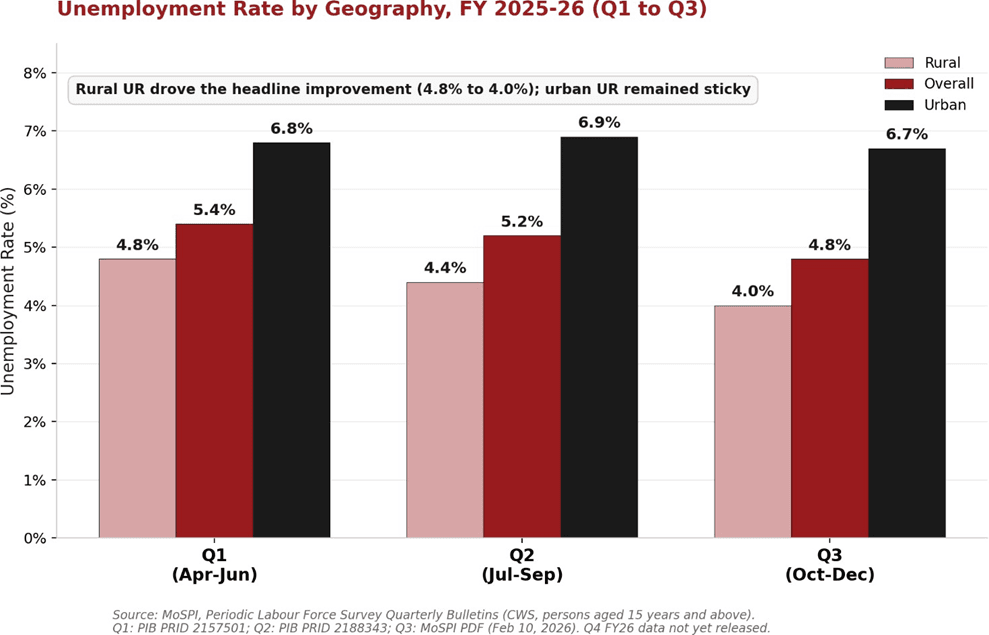
The structural recovery in domestic output yielded tangible and progressive improvements in labour absorption. High-frequency data from the Periodic Labour Force Survey indicates a consistent downward trajectory in the overall unemployment rate, which improved from 5.4% in the first quarter to 4.8% by the third quarter. This positive trend was visible across both rural and urban demographics, signalling that the robust industrial and services momentum successfully translated into actual job creation.
Most importantly, this decline in unemployment occurred alongside a structural expansion of the workforce itself. The overall Labour Force Participation Rate rose steadily to 55.8%, driven by a significant increase in female workforce participation, which climbed to 34.9%. Furthermore, the total employed population expanded to 57.4 crore individuals. This concurrent improvement in participation and employment ratios represents a structurally positive labour market outcome, where economic expansion is translating into measurable workforce absorption across demographics rather than reflecting compositional shifts in survey methodology.
DATA SOURCES
Data referenced in this report is sourced from: Ministry of Statistics and Programme Implementation (MoSPI) Second Advance Estimates of GDP (new series, base 2022-23) and CPI releases; Reserve Bank of India (RBI) Monetary Policy communications and weekly statistical supplement; Central Board of Indirect Taxes and Customs (CBIC) GST collection releases; Office of the Economic Adviser (OEA) IIP and WPI data; National Payments Corporation of India (NPCI) UPI transaction data; Goods and Services Tax Network (GSTN) e-way bill data; Controller General of Accounts (CGA) monthly fiscal accounts; Union Budget documents (indiabudget.gov.in); Ministry of Agriculture and Farmers Welfare (MoAFW) Second Advance Estimates of crop production; Federation of Automobile Dealers Associations (FADA) and Tractor and Mechanisation Association (TMA) retail vehicle sales data; Periodic Labour Force Survey (PLFS) quarterly bulletins, National Statistics Office (NSO/MoSPI); Press Information Bureau (PIB); and press releases from the Ministry of Commerce and Industry. Global figures are sourced from IMF World Economic Outlook (October 2025), Federal Reserve FOMC communications, and the U.S. Energy Information Administration (EIA). Market data for bond yields and exchange rates sourced from trading platforms.